Full Annual Report 2006 - Singapore Technologies Engineering
Full Annual Report 2006 - Singapore Technologies Engineering
Full Annual Report 2006 - Singapore Technologies Engineering

Create successful ePaper yourself
Turn your PDF publications into a flip-book with our unique Google optimized e-Paper software.
209<br />
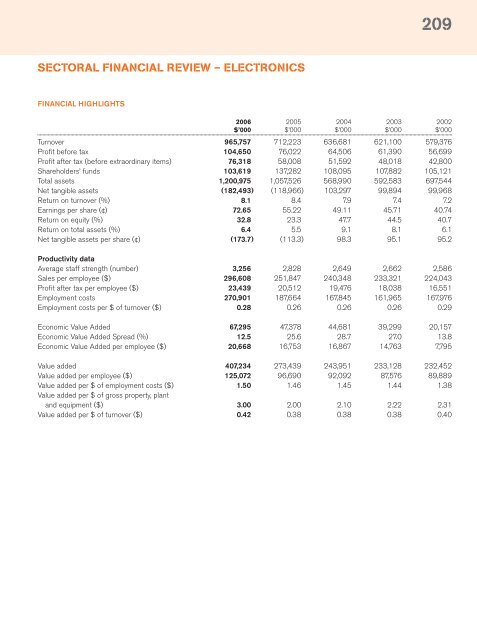
SECTORAL FINANCIAL REVIEW – ELECTRONICS<br />
FINANCIAL HIGHLIGHTS<br />
<strong>2006</strong> 2005 2004 2003 2002<br />
$’000 $’000 $’000 $’000 $’000<br />
Turnover 965,757 712,223 636,681 621,100 579,376<br />
Profit before tax 104,650 76,022 64,506 61,390 56,699<br />
Profit after tax (before extraordinary items) 76,318 58,008 51,592 48,018 42,800<br />
Shareholders’ funds 103,619 137,282 108,095 107,882 105,121<br />
Total assets 1,200,975 1,057,526 568,990 592,583 697,544<br />
Net tangible assets (182,493) (118,966) 103,297 99,894 99,968<br />
Return on turnover (%) 8.1 8.4 7.9 7.4 7.2<br />
Earnings per share (¢) 72.65 55.22 49.11 45.71 40.74<br />
Return on equity (%) 32.8 23.3 47.7 44.5 40.7<br />
Return on total assets (%) 6.4 5.5 9.1 8.1 6.1<br />
Net tangible assets per share (¢) (173.7) (113.3) 98.3 95.1 95.2<br />
Productivity data<br />
Average staff strength (number) 3,256 2,828 2,649 2,662 2,586<br />
Sales per employee ($) 296,608 251,847 240,348 233,321 224,043<br />
Profit after tax per employee ($) 23,439 20,512 19,476 18,038 16,551<br />
Employment costs 270,901 187,664 167,845 161,965 167,976<br />
Employment costs per $ of turnover ($) 0.28 0.26 0.26 0.26 0.29<br />
Economic Value Added 67,295 47,378 44,681 39,299 20,157<br />
Economic Value Added Spread (%) 12.5 25.6 28.7 27.0 13.8<br />
Economic Value Added per employee ($) 20,668 16,753 16,867 14,763 7,795<br />
Value added 407,234 273,439 243,951 233,128 232,452<br />
Value added per employee ($) 125,072 96,690 92,092 87,576 89,889<br />
Value added per $ of employment costs ($) 1.50 1.46 1.45 1.44 1.38<br />
Value added per $ of gross property, plant<br />
and equipment ($) 3.00 2.00 2.10 2.22 2.31<br />
Value added per $ of turnover ($) 0.42 0.38 0.38 0.38 0.40