Full Annual Report 2006 - Singapore Technologies Engineering
Full Annual Report 2006 - Singapore Technologies Engineering
Full Annual Report 2006 - Singapore Technologies Engineering

Create successful ePaper yourself
Turn your PDF publications into a flip-book with our unique Google optimized e-Paper software.
THE WINNING SPIRIT ST <strong>Engineering</strong> AR <strong>2006</strong> 132<br />
Notes to the Financial Statements 31 DECEMBER <strong>2006</strong><br />
(Currency – <strong>Singapore</strong> dollars unless otherwise stated)<br />
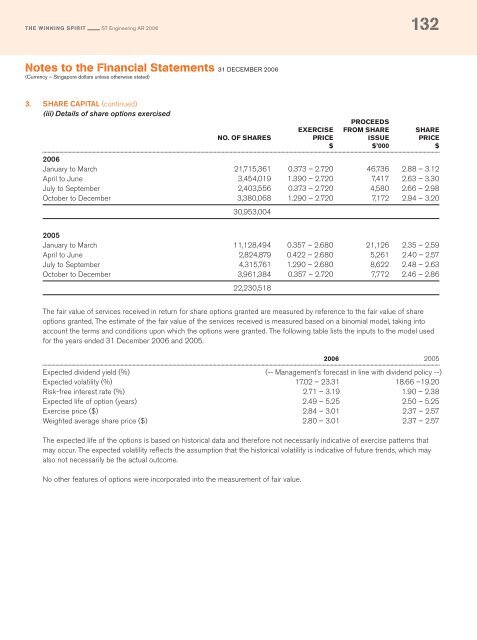
3. SHARE CAPITAL (continued)<br />
(iii) Details of share options exercised<br />
PROCEEDS<br />
EXERCISE FROM SHARE SHARE<br />
NO. OF SHARES PRICE ISSUE PRICE<br />
$ $’000 $<br />
<strong>2006</strong><br />
January to March 21,715,361 0.373 – 2.720 46,736 2.88 – 3.12<br />
April to June 3,454,019 1.390 – 2.720 7,417 2.63 – 3.30<br />
July to September 2,403,556 0.373 – 2.720 4,580 2.66 – 2.98<br />
October to December 3,380,068 1.290 – 2.720 7,172 2.94 – 3.20<br />
30,953,004<br />
2005<br />
January to March 11,128,494 0.357 – 2.680 21,126 2.35 – 2.59<br />
April to June 2,824,879 0.422 – 2.680 5,261 2.40 – 2.57<br />
July to September 4,315,761 1.290 – 2.680 8,622 2.48 – 2.63<br />
October to December 3,961,384 0.357 – 2.720 7,772 2.46 – 2.86<br />
22,230,518<br />
The fair value of services received in return for share options granted are measured by reference to the fair value of share<br />
options granted. The estimate of the fair value of the services received is measured based on a binomial model, taking into<br />
account the terms and conditions upon which the options were granted. The following table lists the inputs to the model used<br />
for the years ended 31 December <strong>2006</strong> and 2005.<br />
<strong>2006</strong> 2005<br />
Expected dividend yield (%) (-- Management’s forecast in line with dividend policy --)<br />
Expected volatility (%) 17.02 – 23.31 18.66 –19.20<br />
Risk-free interest rate (%) 2.71 – 3.19 1.90 – 2.38<br />
Expected life of option (years) 2.49 – 5.25 2.50 – 5.25<br />
Exercise price ($) 2.84 – 3.01 2.37 – 2.57<br />
Weighted average share price ($) 2.80 – 3.01 2.37 – 2.57<br />
The expected life of the options is based on historical data and therefore not necessarily indicative of exercise patterns that<br />
may occur. The expected volatility reflects the assumption that the historical volatility is indicative of future trends, which may<br />
also not necessarily be the actual outcome.<br />
No other features of options were incorporated into the measurement of fair value.