Full Annual Report 2006 - Singapore Technologies Engineering
Full Annual Report 2006 - Singapore Technologies Engineering
Full Annual Report 2006 - Singapore Technologies Engineering

Create successful ePaper yourself
Turn your PDF publications into a flip-book with our unique Google optimized e-Paper software.
THE WINNING SPIRIT ST <strong>Engineering</strong> AR <strong>2006</strong> 208<br />
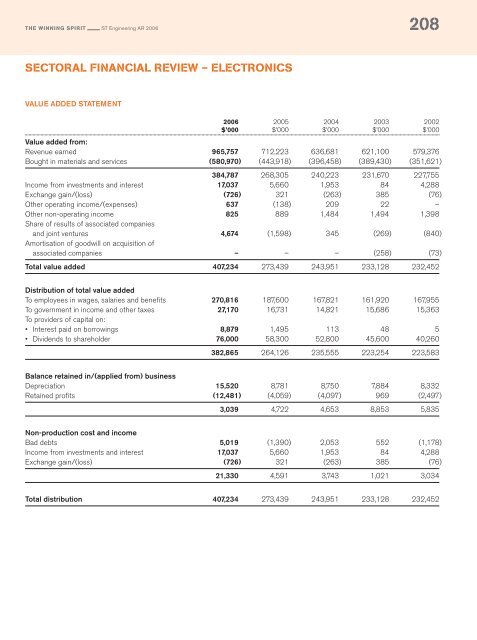
SECTORAL FINANCIAL REVIEW – ELECTRONICS<br />
VALUE ADDED STATEMENT<br />
<strong>2006</strong> 2005 2004 2003 2002<br />
$’000 $’000 $’000 $’000 $’000<br />
Value added from:<br />
Revenue earned 965,757 712,223 636,681 621,100 579,376<br />
Bought in materials and services (580,970) (443,918) (396,458) (389,430) (351,621)<br />
384,787 268,305 240,223 231,670 227,755<br />
Income from investments and interest 17,037 5,660 1,953 84 4,288<br />
Exchange gain/(loss) (726) 321 (263) 385 (76)<br />
Other operating income/(expenses) 637 (138) 209 22 –<br />
Other non-operating income 825 889 1,484 1,494 1,398<br />
Share of results of associated companies<br />
and joint ventures 4,674 (1,598) 345 (269) (840)<br />
Amortisation of goodwill on acquisition of<br />
associated companies – – – (258) (73)<br />
Total value added 407,234 273,439 243,951 233,128 232,452<br />
Distribution of total value added<br />
To employees in wages, salaries and benefits 270,816 187,600 167,821 161,920 167,955<br />
To government in income and other taxes 27,170 16,731 14,821 15,686 15,363<br />
To providers of capital on:<br />
• Interest paid on borrowings 8,879 1,495 113 48 5<br />
• Dividends to shareholder 76,000 58,300 52,800 45,600 40,260<br />
382,865 264,126 235,555 223,254 223,583<br />
Balance retained in/(applied from) business<br />
Depreciation 15,520 8,781 8,750 7,884 8,332<br />
Retained profits (12,481) (4,059) (4,097) 969 (2,497)<br />
3,039 4,722 4,653 8,853 5,835<br />
Non-production cost and income<br />
Bad debts 5,019 (1,390) 2,053 552 (1,178)<br />
Income from investments and interest 17,037 5,660 1,953 84 4,288<br />
Exchange gain/(loss) (726) 321 (263) 385 (76)<br />
21,330 4,591 3,743 1,021 3,034<br />
Total distribution 407,234 273,439 243,951 233,128 232,452