Full Annual Report 2006 - Singapore Technologies Engineering
Full Annual Report 2006 - Singapore Technologies Engineering
Full Annual Report 2006 - Singapore Technologies Engineering

You also want an ePaper? Increase the reach of your titles
YUMPU automatically turns print PDFs into web optimized ePapers that Google loves.
213<br />
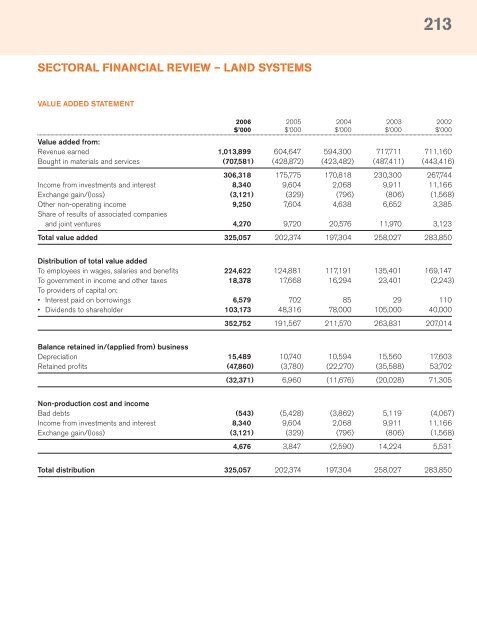
SECTORAL FINANCIAL REVIEW – LAND SYSTEMS<br />
VALUE ADDED STATEMENT<br />
<strong>2006</strong> 2005 2004 2003 2002<br />
$’000 $’000 $’000 $’000 $’000<br />
Value added from:<br />
Revenue earned 1,013,899 604,647 594,300 717,711 711,160<br />
Bought in materials and services (707,581) (428,872) (423,482) (487,411) (443,416)<br />
306,318 175,775 170,818 230,300 267,744<br />
Income from investments and interest 8,340 9,604 2,068 9,911 11,166<br />
Exchange gain/(loss) (3,121) (329) (796) (806) (1,568)<br />
Other non-operating income 9,250 7,604 4,638 6,652 3,385<br />
Share of results of associated companies<br />
and joint ventures 4,270 9,720 20,576 11,970 3,123<br />
Total value added 325,057 202,374 197,304 258,027 283,850<br />
Distribution of total value added<br />
To employees in wages, salaries and benefits 224,622 124,881 117,191 135,401 169,147<br />
To government in income and other taxes 18,378 17,668 16,294 23,401 (2,243)<br />
To providers of capital on:<br />
• Interest paid on borrowings 6,579 702 85 29 110<br />
• Dividends to shareholder 103,173 48,316 78,000 105,000 40,000<br />
352,752 191,567 211,570 263,831 207,014<br />
Balance retained in/(applied from) business<br />
Depreciation 15,489 10,740 10,594 15,560 17,603<br />
Retained profits (47,860) (3,780) (22,270) (35,588) 53,702<br />
(32,371) 6,960 (11,676) (20,028) 71,305<br />
Non-production cost and income<br />
Bad debts (543) (5,428) (3,862) 5,119 (4,067)<br />
Income from investments and interest 8,340 9,604 2,068 9,911 11,166<br />
Exchange gain/(loss) (3,121) (329) (796) (806) (1,568)<br />
4,676 3,847 (2,590) 14,224 5,531<br />
Total distribution 325,057 202,374 197,304 258,027 283,850