- Page 1 and 2: THE WINNING SPIRIT ANNUAL REPORT 20
- Page 3 and 4: 1 The winning spirit entails more t
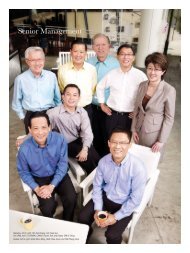
- Page 5 and 6: 11 Peter SEAH Lim Huat Chairman (le
- Page 7 and 8: 13 In 2007, we will continue to gro
- Page 10 and 11: THE WINNING SPIRIT ST Engineering A
- Page 14 and 15: THE WINNING SPIRIT ST Engineering A
- Page 16 and 17: THE WINNING SPIRIT ST Engineering A
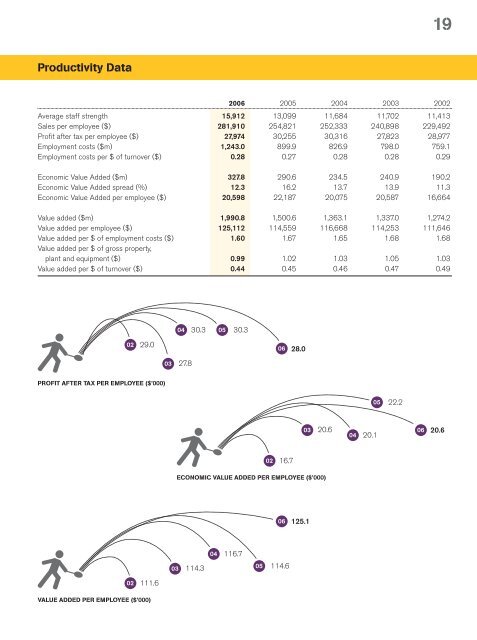
- Page 18 and 19: THE WINNING SPIRIT ST Engineering A
- Page 20 and 21: THE WINNING SPIRIT ST Engineering A
- Page 22 and 23: THE WINNING SPIRIT ST Engineering A
- Page 24 and 25: THE WINNING SPIRIT ST Engineering A
- Page 26 and 27: 33 Corporate Governance Board’s C
- Page 28 and 29: 35 Corporate Governance BOARD COMPO
- Page 30 and 31: 37 Corporate Governance The ERCC me
- Page 32 and 33: 39 Corporate Governance Remuneratio
- Page 34 and 35: 41 Corporate Governance Internal Co
- Page 36 and 37: 43 Corporate Governance COMPLIANCE
- Page 38 and 39: 45 Environment, Health and Safety A
- Page 40 and 41: 47 Investor Relations ST ENGINEERIN
- Page 42 and 43: 49 Share Price Performance ST ENGIN
- Page 44 and 45: THE WINNING SPIRIT ST Engineering A
- Page 46 and 47: THE WINNING SPIRIT ST Engineering A
- Page 48 and 49: 57 Operating Financial Review GROUP
- Page 50 and 51: 59 Operating Financial Review PERFO
- Page 52 and 53: 61 Operating Financial Review Capit
- Page 54 and 55: LAND SYSTEMS SECTOR MARINE SECTOR C
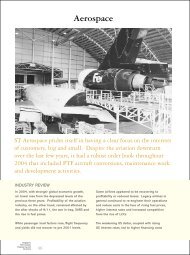
- Page 56 and 57: 67 Aerospace FLYING HIGH WITH TOTAL
- Page 58 and 59: 69 Aerospace Full Year Performance
- Page 60 and 61: THE WINNING SPIRIT ST Engineering A
- Page 62 and 63:
75 Land Systems BREAKING NEW GROUND
- Page 64 and 65:
77 Land Systems Major Acquisitions
- Page 66 and 67:
THE WINNING SPIRIT ST Engineering A
- Page 68 and 69:
THE WINNING SPIRIT ST Engineering A
- Page 70 and 71:
THE WINNING SPIRIT ST Engineering A
- Page 72 and 73:
THE WINNING SPIRIT ST Engineering A
- Page 74 and 75:
THE WINNING SPIRIT ST Engineering A
- Page 76 and 77:
91 Directors’ Report AS AT 31 DEC
- Page 78 and 79:
93 Directors’ Report AS AT 31 DEC
- Page 80 and 81:
95 Directors’ Report AS AT 31 DEC
- Page 82 and 83:
97 Directors’ Report AS AT 31 DEC
- Page 84 and 85:
99 Directors’ Report AS AT 31 DEC
- Page 86 and 87:
101 Directors’ Report AS AT 31 DE
- Page 88 and 89:
103 Statement by Directors We, Pete
- Page 90 and 91:
105 Balance Sheets AS AT 31 DECEMBE
- Page 92 and 93:
107 Statements of Changes in Equity
- Page 94 and 95:
109 Consolidated Statement of Cash
- Page 96 and 97:
111 Consolidated Statement of Cash
- Page 98 and 99:
113 Notes to the Financial Statemen
- Page 100 and 101:
115 Notes to the Financial Statemen
- Page 102 and 103:
117 Notes to the Financial Statemen
- Page 104 and 105:
119 Notes to the Financial Statemen
- Page 106 and 107:
121 Notes to the Financial Statemen
- Page 108 and 109:
123 Notes to the Financial Statemen
- Page 110 and 111:
125 Notes to the Financial Statemen
- Page 112 and 113:
127 Notes to the Financial Statemen
- Page 114 and 115:
129 Notes to the Financial Statemen
- Page 116 and 117:
131 Notes to the Financial Statemen
- Page 118 and 119:
133 Notes to the Financial Statemen
- Page 120 and 121:
135 Notes to the Financial Statemen
- Page 122 and 123:
137 Notes to the Financial Statemen
- Page 124 and 125:
139 Notes to the Financial Statemen
- Page 126 and 127:
141 Notes to the Financial Statemen
- Page 128 and 129:
143 Notes to the Financial Statemen
- Page 130 and 131:
145 Notes to the Financial Statemen
- Page 132 and 133:
147 Notes to the Financial Statemen
- Page 134 and 135:
149 Notes to the Financial Statemen
- Page 136 and 137:
151 Notes to the Financial Statemen
- Page 138 and 139:
153 Notes to the Financial Statemen
- Page 140 and 141:
155 Notes to the Financial Statemen
- Page 142 and 143:
157 Notes to the Financial Statemen
- Page 144 and 145:
159 Notes to the Financial Statemen
- Page 146 and 147:
161 Notes to the Financial Statemen
- Page 148 and 149:
163 Notes to the Financial Statemen
- Page 150 and 151:
165 Notes to the Financial Statemen
- Page 152 and 153:
167 Notes to the Financial Statemen
- Page 154 and 155:
169 Notes to the Financial Statemen
- Page 156 and 157:
171 Notes to the Financial Statemen
- Page 158 and 159:
173 Notes to the Financial Statemen
- Page 160 and 161:
175 Notes to the Financial Statemen
- Page 162 and 163:
177 Notes to the Financial Statemen
- Page 164 and 165:
179 Notes to the Financial Statemen
- Page 166 and 167:
181 Notes to the Financial Statemen
- Page 168 and 169:
183 Notes to the Financial Statemen
- Page 170 and 171:
185 Notes to the Financial Statemen
- Page 172 and 173:
187 Notes to the Financial Statemen
- Page 174 and 175:
189 Notes to the Financial Statemen
- Page 176 and 177:
191 Notes to the Financial Statemen
- Page 178 and 179:
193 Notes to the Financial Statemen
- Page 180 and 181:
195 Notes to the Financial Statemen
- Page 182 and 183:
197 SGX Listing Manual Requirements
- Page 184 and 185:
199 Shareholding Statistics AS AT 5
- Page 186 and 187:
201 SECTORAL FINANCIAL REVIEW - AER
- Page 188 and 189:
203 SECTORAL FINANCIAL REVIEW - AER
- Page 190 and 191:
205 SECTORAL FINANCIAL REVIEW - ELE
- Page 192 and 193:
207 SECTORAL FINANCIAL REVIEW - ELE
- Page 194 and 195:
209 SECTORAL FINANCIAL REVIEW - ELE
- Page 196 and 197:
211 SECTORAL FINANCIAL REVIEW - LAN
- Page 198 and 199:
213 SECTORAL FINANCIAL REVIEW - LAN
- Page 200 and 201:
215 SECTORAL FINANCIAL REVIEW - MAR
- Page 202 and 203:
217 SECTORAL FINANCIAL REVIEW - MAR
- Page 204 and 205:
219 SECTORAL FINANCIAL REVIEW - MAR
- Page 206 and 207:
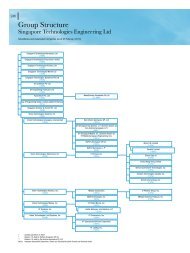
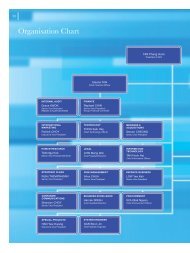
221 Group Structure - Singapore Tec
- Page 208 and 209:
223 Group Structure - Singapore Tec
- Page 210 and 211:
225 CORPORATE INFORMATION BOARD OF
- Page 212 and 213:
SINGAPORE TECHNOLOGIES ENGINEERING
- Page 214:
2 fold this dotted line > Postage w