Full Annual Report 2006 - Singapore Technologies Engineering
Full Annual Report 2006 - Singapore Technologies Engineering
Full Annual Report 2006 - Singapore Technologies Engineering
You also want an ePaper? Increase the reach of your titles
YUMPU automatically turns print PDFs into web optimized ePapers that Google loves.
219<br />
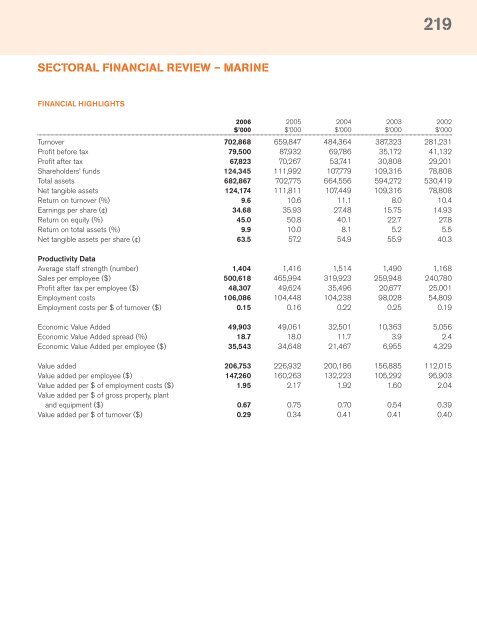
SECTORAL FINANCIAL REVIEW – MARINE<br />
FINANCIAL HIGHLIGHTS<br />
<strong>2006</strong> 2005 2004 2003 2002<br />
$’000 $’000 $’000 $’000 $’000<br />
Turnover 702,868 659,847 484,364 387,323 281,231<br />
Profit before tax 79,500 87,932 69,786 35,172 41,132<br />
Profit after tax 67,823 70,267 53,741 30,808 29,201<br />
Shareholders’ funds 124,345 111,992 107,779 109,316 78,808<br />
Total assets 682,867 702,775 664,556 594,272 530,419<br />
Net tangible assets 124,174 111,811 107,449 109,316 78,808<br />
Return on turnover (%) 9.6 10.6 11.1 8.0 10.4<br />
Earnings per share (¢) 34.68 35.93 27.48 15.75 14.93<br />
Return on equity (%) 45.0 50.8 40.1 22.7 27.8<br />
Return on total assets (%) 9.9 10.0 8.1 5.2 5.5<br />
Net tangible assets per share (¢) 63.5 57.2 54.9 55.9 40.3<br />
Productivity Data<br />
Average staff strength (number) 1,404 1,416 1,514 1,490 1,168<br />
Sales per employee ($) 500,618 465,994 319,923 259,948 240,780<br />
Profit after tax per employee ($) 48,307 49,624 35,496 20,677 25,001<br />
Employment costs 106,086 104,448 104,238 98,028 54,809<br />
Employment costs per $ of turnover ($) 0.15 0.16 0.22 0.25 0.19<br />
Economic Value Added 49,903 49,061 32,501 10,363 5,056<br />
Economic Value Added spread (%) 18.7 18.0 11.7 3.9 2.4<br />
Economic Value Added per employee ($) 35,543 34,648 21,467 6,955 4,329<br />
Value added 206,753 226,932 200,186 156,885 112,015<br />
Value added per employee ($) 147,260 160,263 132,223 105,292 95,903<br />
Value added per $ of employment costs ($) 1.95 2.17 1.92 1.60 2.04<br />
Value added per $ of gross property, plant<br />
and equipment ($) 0.67 0.75 0.70 0.54 0.39<br />
Value added per $ of turnover ($) 0.29 0.34 0.41 0.41 0.40


