Full Annual Report 2006 - Singapore Technologies Engineering
Full Annual Report 2006 - Singapore Technologies Engineering
Full Annual Report 2006 - Singapore Technologies Engineering

You also want an ePaper? Increase the reach of your titles
YUMPU automatically turns print PDFs into web optimized ePapers that Google loves.
THE WINNING SPIRIT ST <strong>Engineering</strong> AR <strong>2006</strong> 186<br />
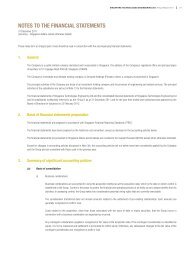
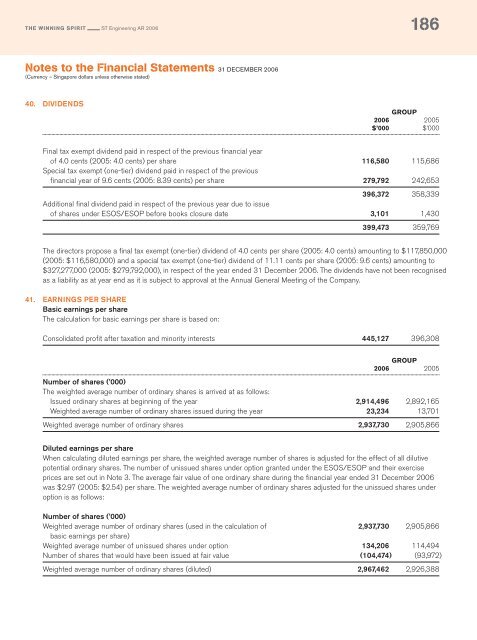
Notes to the Financial Statements 31 DECEMBER <strong>2006</strong><br />
(Currency – <strong>Singapore</strong> dollars unless otherwise stated)<br />
40. DIVIDENDS<br />
GROUP<br />
<strong>2006</strong> 2005<br />
$’000 $’000<br />
Final tax exempt dividend paid in respect of the previous financial year<br />
of 4.0 cents (2005: 4.0 cents) per share 116,580 115,686<br />
Special tax exempt (one-tier) dividend paid in respect of the previous<br />
financial year of 9.6 cents (2005: 8.39 cents) per share 279,792 242,653<br />
396,372 358,339<br />
Additional final dividend paid in respect of the previous year due to issue<br />
of shares under ESOS/ESOP before books closure date 3,101 1,430<br />
399,473 359,769<br />
The directors propose a final tax exempt (one-tier) dividend of 4.0 cents per share (2005: 4.0 cents) amounting to $117,850,000<br />
(2005: $116,580,000) and a special tax exempt (one-tier) dividend of 11.11 cents per share (2005: 9.6 cents) amounting to<br />
$327,277,000 (2005: $279,792,000), in respect of the year ended 31 December <strong>2006</strong>. The dividends have not been recognised<br />
as a liability as at year end as it is subject to approval at the <strong>Annual</strong> General Meeting of the Company.<br />
41. EARNINGS PER SHARE<br />
Basic earnings per share<br />
The calculation for basic earnings per share is based on:<br />
Consolidated profit after taxation and minority interests 445,127 396,308<br />
GROUP<br />
<strong>2006</strong> 2005<br />
Number of shares (’000)<br />
The weighted average number of ordinary shares is arrived at as follows:<br />
Issued ordinary shares at beginning of the year 2,914,496 2,892,165<br />
Weighted average number of ordinary shares issued during the year 23,234 13,701<br />
Weighted average number of ordinary shares 2,937,730 2,905,866<br />
Diluted earnings per share<br />
When calculating diluted earnings per share, the weighted average number of shares is adjusted for the effect of all dilutive<br />
potential ordinary shares. The number of unissued shares under option granted under the ESOS/ESOP and their exercise<br />
prices are set out in Note 3. The average fair value of one ordinary share during the financial year ended 31 December <strong>2006</strong><br />
was $2.97 (2005: $2.54) per share. The weighted average number of ordinary shares adjusted for the unissued shares under<br />
option is as follows:<br />
Number of shares (’000)<br />
Weighted average number of ordinary shares (used in the calculation of 2,937,730 2,905,866<br />
basic earnings per share)<br />
Weighted average number of unissued shares under option 134,206 114,494<br />
Number of shares that would have been issued at fair value (104,474) (93,972)<br />
Weighted average number of ordinary shares (diluted) 2,967,462 2,926,388