Sterlite Industries (India) Limited - Sterlite Industries India Ltd.
Sterlite Industries (India) Limited - Sterlite Industries India Ltd.
Sterlite Industries (India) Limited - Sterlite Industries India Ltd.

Create successful ePaper yourself
Turn your PDF publications into a flip-book with our unique Google optimized e-Paper software.
Market Outlook<br />
Global Aluminum Outlook<br />
According to Brook Hunt, primary aluminum production is expected to decrease by 7.4% between 2007 and 2010. This is due to production<br />
cuts announced by various producers throughout the world which are intended to reduce the supply demand gap created by the global economic<br />
downturn. However, primary aluminum production is expected to decrease by 5.2% from 2009 to 2010.<br />
After six years of strong growth led by China, in 2008 the downturn in the cycle for aluminum production began. In China, growth in the<br />
production of aluminum fell from 34.6% from 2006 to 2007 to 4.7% from 2007 to 2008. By the end of 2008, declining demand for aluminum<br />
from North America, Japan and Europe saw growth in aluminum production stagnate.<br />
At the beginning of 2008, global consumption of aluminum was expected to continue to rise but at a growth rate lower than the 10.4% that<br />
occurred between 2006 and 2007. The decline in consumption is expected to continue in 2009 with global aluminum consumption forecast to<br />
fall 8.3%. Aluminum consumption is expected to increase by 1.8% from 2009 to 2010.<br />
<strong>India</strong>n Aluminum Outlook<br />
According to Brook Hunt’s June 2009 report, over the next four to five years, the domestic demand for the aluminum industry is expected to<br />
grow at a compound annual growth rate of 8.5%, primarily driven by expected growth in consumer demand as a result of higher disposable<br />
incomes and investment in infrastructure by the Government of <strong>India</strong>.<br />
In addition, with the enactment of the <strong>India</strong>n Electricity Act, 2003 and the opening up of power markets, the adequacy of transmission<br />
facilities has become a critical point for market efficiency and development. The Government of <strong>India</strong>’s commitment to “Power for All” by<br />
2012, capacity additions from 9,500 MW to 37,000 MW by 2012 in inter-regional transmission and distribution, and investments of Rs. 2<br />
trillion ($50.0 billion) in transmission and distribution are all expected to translate into a higher consumption of aluminum.<br />
According to Brook Hunt, economic growth in <strong>India</strong> is less reliant on external demand and as a consequence <strong>India</strong> is likely to be less<br />
affected by the global downturn than more export-driven economies. Nevertheless, the recession in the world’s mature economies is weighing<br />
on demand for <strong>India</strong>n goods and industrial production contracted year on year in December 2008 and in January 2009, at modest declines of<br />
0.6% and 0.5%, respectively. The Government of <strong>India</strong> has responded to the global downturn with two fiscal stimulus packages and these<br />
should cushion, but not halt, the decline. According to Brook Hunt, industrial production will fall by 1% in 2009 with growth forecast to<br />
resume in 2010. Despite the decline in industrial production, the <strong>India</strong>n government’s infrastructure investments will support aluminum<br />
consumption. Following growth of 7% in 2008, <strong>India</strong>’s primary aluminum consumption is expected to decrease marginally by 1.5% in 2009<br />
before recovering to grow 6.5% in 2010. As the global economy begins to recover, growth is expected to increase to 7.7% in 2011 and 10.9%<br />
in 2012. In the longer term, consumption of aluminum in <strong>India</strong> is expected to rise from 1.3 million tons in 2008 to 3.4 million tons in 2020,<br />
representing a compound annual growth rate of 8.3%, making <strong>India</strong> the world’s largest national market, after China and the US. This compares<br />
to world demand for aluminum, which Brook Hunt estimates will grow from 38.0 million tons in 2008 to 57.1 million tons in 2020,<br />
representing a compound annual growth rate of 3.5%.<br />
Commercial Power Generation Business<br />
Industry Overview<br />
The <strong>India</strong>n Electricity Act, 2003 was enacted in order to eliminate the multiple legislation governing the electricity generation, transmission<br />
and distribution sectors and to enhance the scope of power sector reforms aimed at addressing systemic deficiencies in the <strong>India</strong>n power<br />
industry. The key provisions of the <strong>India</strong>n Electricity Act, 2003 allowed for de-licensing of power generation, open access in power<br />
transmission and distribution, unbundling of State Electricity Boards, or SEBs, compulsory metering of all consumers and more stringent<br />
penalties for the theft of electricity. It also included provisions to facilitate captive power plants.<br />
However, the pace of implementation of these reforms varies across states. The <strong>India</strong>n Electricity Act, 2003 read with the National Tariff<br />
Policy, or NTP, notified in January 2006 also mandates that all future power purchases by distribution licensees must be based on competitive<br />
bidding to obtain the benefits of reduced capital costs and efficiency of operations through competition.<br />
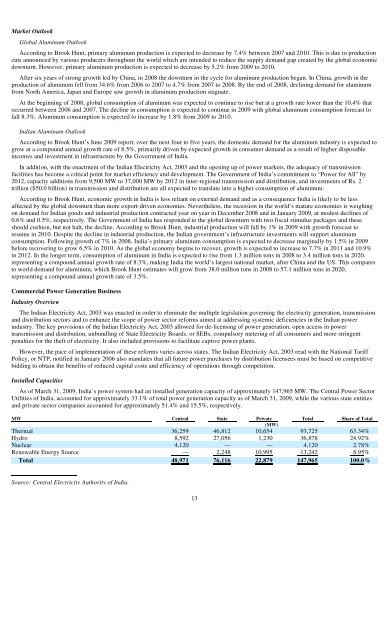
Installed Capacities<br />
As of March 31, 2009, <strong>India</strong>’s power system had an installed generation capacity of approximately 147,965 MW. The Central Power Sector<br />
Utilities of <strong>India</strong>, accounted for approximately 33.1% of total power generation capacity as of March 31, 2009, while the various state entities<br />
and private sector companies accounted for approximately 51.4% and 15.5%, respectively.<br />
MW Central State Private Total Share of Total<br />
(MW)<br />
Thermal 36,259 46,812 10,654 93,725 63.34%<br />
Hydro 8,592 27,056 1,230 36,878 24.92%<br />
Nuclear 4,120 — — 4,120 2.78%<br />
Renewable Energy Source — 2,248 10,995 13,242 8.95%<br />
Total 48,971 76,116 22,879 147,965 100.0%<br />
Source: Central Electricity Authority of <strong>India</strong>.<br />
13