Sterlite Industries (India) Limited - Sterlite Industries India Ltd.
Sterlite Industries (India) Limited - Sterlite Industries India Ltd.
Sterlite Industries (India) Limited - Sterlite Industries India Ltd.

You also want an ePaper? Increase the reach of your titles
YUMPU automatically turns print PDFs into web optimized ePapers that Google loves.
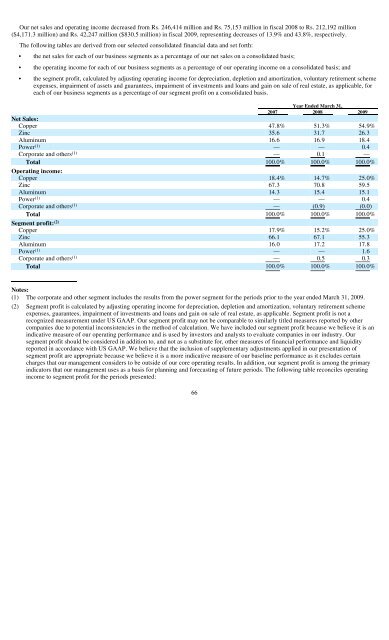
Our net sales and operating income decreased from Rs. 246,414 million and Rs. 75,153 million in fiscal 2008 to Rs. 212,192 million<br />
($4,171.3 million) and Rs. 42,247 million ($830.5 million) in fiscal 2009, representing decreases of 13.9% and 43.8%, respectively.<br />
The following tables are derived from our selected consolidated financial data and set forth:<br />
• the net sales for each of our business segments as a percentage of our net sales on a consolidated basis;<br />
• the operating income for each of our business segments as a percentage of our operating income on a consolidated basis; and<br />
• the segment profit, calculated by adjusting operating income for depreciation, depletion and amortization, voluntary retirement scheme<br />
expenses, impairment of assets and guarantees, impairment of investments and loans and gain on sale of real estate, as applicable, for<br />
each of our business segments as a percentage of our segment profit on a consolidated basis.<br />
Year Ended March 31,<br />
2007 2008 2009<br />
Net Sales:<br />
Copper 47.8% 51.3% 54.9%<br />
Zinc 35.6 31.7 26.3<br />
Aluminum 16.6 16.9 18.4<br />
Power (1) — — 0.4<br />
Corporate and others (1) — 0.1 —<br />
Total 100.0% 100.0% 100.0%<br />
Operating income:<br />
Copper 18.4% 14.7% 25.0%<br />
Zinc 67.3 70.8 59.5<br />
Aluminum 14.3 15.4 15.1<br />
Power (1) — — 0.4<br />
Corporate and others (1) — (0.9) (0.0)<br />
Total 100.0% 100.0% 100.0%<br />
Segment profit: (2)<br />
Copper 17.9% 15.2% 25.0%<br />
Zinc 66.1 67.1 55.3<br />
Aluminum 16.0 17.2 17.8<br />
Power (1) — — 1.6<br />
Corporate and others (1) — 0.5 0.3<br />
Total 100.0% 100.0% 100.0%<br />
Notes:<br />
(1) The corporate and other segment includes the results from the power segment for the periods prior to the year ended March 31, 2009.<br />
(2) Segment profit is calculated by adjusting operating income for depreciation, depletion and amortization, voluntary retirement scheme<br />
expenses, guarantees, impairment of investments and loans and gain on sale of real estate, as applicable. Segment profit is not a<br />
recognized measurement under US GAAP. Our segment profit may not be comparable to similarly titled measures reported by other<br />
companies due to potential inconsistencies in the method of calculation. We have included our segment profit because we believe it is an<br />
indicative measure of our operating performance and is used by investors and analysts to evaluate companies in our industry. Our<br />
segment profit should be considered in addition to, and not as a substitute for, other measures of financial performance and liquidity<br />
reported in accordance with US GAAP. We believe that the inclusion of supplementary adjustments applied in our presentation of<br />
segment profit are appropriate because we believe it is a more indicative measure of our baseline performance as it excludes certain<br />
charges that our management considers to be outside of our core operating results. In addition, our segment profit is among the primary<br />
indicators that our management uses as a basis for planning and forecasting of future periods. The following table reconciles operating<br />
income to segment profit for the periods presented:<br />
66