Sterlite Industries (India) Limited - Sterlite Industries India Ltd.
Sterlite Industries (India) Limited - Sterlite Industries India Ltd.
Sterlite Industries (India) Limited - Sterlite Industries India Ltd.

You also want an ePaper? Increase the reach of your titles
YUMPU automatically turns print PDFs into web optimized ePapers that Google loves.
Results of Operations<br />
Overview<br />
Consolidated Statement of Operations Data<br />
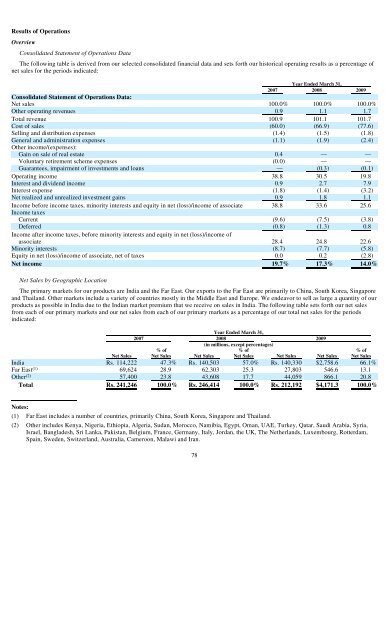
The following table is derived from our selected consolidated financial data and sets forth our historical operating results as a percentage of<br />
net sales for the periods indicated:<br />
Year Ended March 31,<br />
2007 2008 2009<br />
Consolidated Statement of Operations Data:<br />
Net sales 100.0% 100.0% 100.0%<br />
Other operating revenues 0.9 1.1 1.7<br />
Total revenue 100.9 101.1 101.7<br />
Cost of sales (60.0) (66.9) (77.6)<br />
Selling and distribution expenses (1.4) (1.5) (1.8)<br />
General and administration expenses (1.1) (1.9) (2.4)<br />
Other income/(expenses):<br />
Gain on sale of real estate 0.4 — —<br />
Voluntary retirement scheme expenses (0.0) — —<br />
Guarantees, impairment of investments and loans — (0.3) (0.1)<br />
Operating income 38.8 30.5 19.8<br />
Interest and dividend income 0.9 2.7 7.9<br />
Interest expense (1.8) (1.4) (3.2)<br />
Net realized and unrealized investment gains 0.9 1.8 1.1<br />
Income before income taxes, minority interests and equity in net (loss)/income of associate 38.8 33.6 25.6<br />
Income taxes<br />
Current (9.6) (7.5) (3.8)<br />
Deferred (0.8) (1.3)<br />
Income after income taxes, before minority interests and equity in net (loss)/income of<br />
0.8<br />
associate 28.4 24.8 22.6<br />
Minority interests (8.7) (7.7) (5.8)<br />
Equity in net (loss)/income of associate, net of taxes 0.0 0.2 (2.8)<br />
Net income 19.7% 17.3% 14.0%<br />
Net Sales by Geographic Location<br />
The primary markets for our products are <strong>India</strong> and the Far East. Our exports to the Far East are primarily to China, South Korea, Singapore<br />
and Thailand. Other markets include a variety of countries mostly in the Middle East and Europe. We endeavor to sell as large a quantity of our<br />
products as possible in <strong>India</strong> due to the <strong>India</strong>n market premium that we receive on sales in <strong>India</strong>. The following table sets forth our net sales<br />
from each of our primary markets and our net sales from each of our primary markets as a percentage of our total net sales for the periods<br />
indicated:<br />
Year Ended March 31,<br />
2007 2008 2009<br />
(in millions, except percentages)<br />
% of % of % of<br />
Net Sales Net Sales Net Sales Net Sales Net Sales Net Sales Net Sales<br />
<strong>India</strong> Rs. 114,222 47.3% Rs. 140,503 57.0% Rs. 140,330 $2,758.6 66.1%<br />
Far East (1) 69,624 28.9 62,303 25.3 27,803 546.6 13.1<br />
Other (2) 57,400 23.8 43,608 17.7 44,059 866.1 20.8<br />
Total Rs. 241,246 100.0% Rs. 246,414 100.0% Rs. 212,192 $4,171.3 100.0%<br />
Notes:<br />
(1) Far East includes a number of countries, primarily China, South Korea, Singapore and Thailand.<br />
(2) Other includes Kenya, Nigeria, Ethiopia, Algeria, Sudan, Morocco, Namibia, Egypt, Oman, UAE, Turkey, Qatar, Saudi Arabia, Syria,<br />
Israel, Bangladesh, Sri Lanka, Pakistan, Belgium, France, Germany, Italy, Jordan, the UK, The Netherlands, Luxembourg, Rotterdam,<br />
Spain, Sweden, Switzerland, Australia, Cameroon, Malawi and Iran.<br />
78