Sterlite Industries (India) Limited - Sterlite Industries India Ltd.
Sterlite Industries (India) Limited - Sterlite Industries India Ltd.
Sterlite Industries (India) Limited - Sterlite Industries India Ltd.

Create successful ePaper yourself
Turn your PDF publications into a flip-book with our unique Google optimized e-Paper software.
Energy cost is the most significant component of the cost of production in our metal production businesses. Most of our power requirements<br />
are met by captive power plants, which are primarily coal-fueled. Thermal coal, diesel fuel and fuel oil, which are used to operate our power<br />
plants, and metcoke, which is used in the zinc smelting process, are currently sourced from a combination of long-term and spot contracts. Our<br />
aluminum business, which has high energy consumption due to the power-intensive nature of aluminum smelting, sources approximately 66%<br />
of its thermal coal requirement from a subsidiary of Coal <strong>India</strong> under a five-year supply agreement entered into in August 2006. Shortages of<br />
coal at Coal <strong>India</strong> may require that a greater amount of higher priced imported coal be utilized. For example, in April 2005, a shortage of coal<br />
led Coal <strong>India</strong> to reduce the amount of coal supplied to all its customers, except utilities, including BALCO, forcing BALCO to utilize higher<br />
priced imported coal. However, in January 2006, we were allotted a 31.5 million ton share in the Madanpur Coal Block for use in HZL’s<br />
captive power plant. We intend to begin operations at the Madanpur Coal Block by March 2010. In addition, in November 2007, we were<br />
allotted a 211.0 million ton share of a coal block by the Ministry of Coal for use in BALCO’s captive power plant. Any change in coal prices or<br />
the mix of coal that is utilized, primarily whether the coal is sourced locally or imported, can affect the cost of generating power.<br />
For our zinc business and the portions of our copper and aluminum businesses where we source the ore from our own mines, ore extraction<br />
and processing costs affect our cost of production. In our zinc and copper businesses, the ore extraction and processing costs to produce<br />
concentrates are generally a small percentage of our overall cost of production of the finished metals. In our aluminum business, the bauxite ore<br />
extraction cost is not significant but the refining cost to produce alumina from bauxite ore represents approximately one-third of the cost of<br />
production of aluminum. In addition, a significant cost of production in our zinc business is the royalty that HZL pays on the lead-zinc ore that<br />
is mined, which royalty is a function of the LME prices of zinc and lead. See “— Government Policy — Taxes and Royalties.”<br />
Labor costs are principally a function of the number of employees and increases in compensation from time to time. Improvements in labor<br />
productivity in recent years have resulted in a decrease in the per-unit labor costs. We outsource a majority of BALCO’s and Copper Mines of<br />
Tasmania Pty <strong>Ltd</strong>’s, or CMT’s, mining operations, a substantial portion of HZL’s mining operations and a limited number of functions at our<br />
copper, zinc and aluminum smelting operations to third party contractors.<br />
Other manufacturing expenses include, among other things, additional materials and consumables that are used in the production processes<br />
and routine maintenance to sustain ongoing operations. None of these represents a significant portion of our costs of production.<br />
Cost of production as reported for our metal products includes an offset for any amounts we receive upon the sale of the by-products from<br />
the refining or smelting processes. We divide our cost of production by the daily average exchange rate for the year to calculate the US dollar<br />
cost of production per lb or ton of metal as reported.<br />
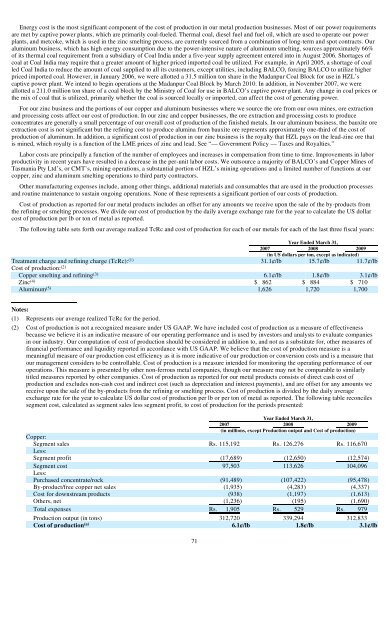
The following table sets forth our average realized TcRc and cost of production for each of our metals for each of the last three fiscal years:<br />
Year Ended March 31,<br />
2007 2008 2009<br />
(in US dollars per ton, except as indicated)<br />
Treatment charge and refining charge (TcRc): (1) 31.1¢/lb 15.7¢/lb 11.7¢/lb<br />
Cost of production: (2)<br />
Copper smelting and refining (3) 6.1¢/lb 1.8¢/lb 3.1¢/lb<br />
Zinc (4) $ 862 $ 884 $ 710<br />
Aluminum (5) 1,626 1,720 1,700<br />
Notes:<br />
(1) Represents our average realized TcRc for the period.<br />
(2) Cost of production is not a recognized measure under US GAAP. We have included cost of production as a measure of effectiveness<br />
because we believe it is an indicative measure of our operating performance and is used by investors and analysts to evaluate companies<br />
in our industry. Our computation of cost of production should be considered in addition to, and not as a substitute for, other measures of<br />
financial performance and liquidity reported in accordance with US GAAP. We believe that the cost of production measure is a<br />
meaningful measure of our production cost efficiency as it is more indicative of our production or conversion costs and is a measure that<br />
our management considers to be controllable. Cost of production is a measure intended for monitoring the operating performance of our<br />
operations. This measure is presented by other non-ferrous metal companies, though our measure may not be comparable to similarly<br />
titled measures reported by other companies. Cost of production as reported for our metal products consists of direct cash cost of<br />
production and excludes non-cash cost and indirect cost (such as depreciation and interest payments), and are offset for any amounts we<br />
receive upon the sale of the by-products from the refining or smelting process. Cost of production is divided by the daily average<br />
exchange rate for the year to calculate US dollar cost of production per lb or per ton of metal as reported. The following table reconciles<br />
segment cost, calculated as segment sales less segment profit, to cost of production for the periods presented:<br />
Year Ended March 31,<br />
2007 2008 2009<br />
(in millions, except Production output and Cost of production)<br />
Copper:<br />
Segment sales Rs. 115,192 Rs. 126,276 Rs. 116,670<br />
Less:<br />
Segment profit (17,689) (12,650) (12,574)<br />
Segment cost 97,503 113,626 104,096<br />
Less:<br />
Purchased concentrate/rock (91,489) (107,422) (95,478)<br />
By-product/free copper net sales (1,935) (4,283) (4,337)<br />
Cost for downstream products (938) (1,197) (1,613)<br />
Others, net (1,236) (195) (1,690)<br />
Total expenses Rs. 1,905 Rs. 529 Rs. 979<br />
Production output (in tons) 312,720 339,294 312,833<br />
Cost of production (a) 6.1¢/lb 1.8¢/lb 3.1¢/lb<br />
71