Sterlite Industries (India) Limited - Sterlite Industries India Ltd.
Sterlite Industries (India) Limited - Sterlite Industries India Ltd.
Sterlite Industries (India) Limited - Sterlite Industries India Ltd.
You also want an ePaper? Increase the reach of your titles
YUMPU automatically turns print PDFs into web optimized ePapers that Google loves.
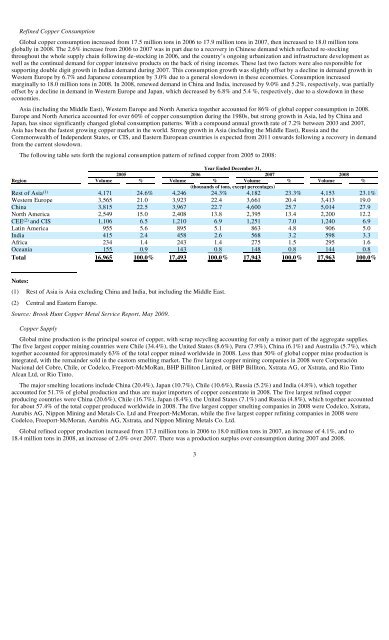
Refined Copper Consumption<br />
Global copper consumption increased from 17.5 million tons in 2006 to 17.9 million tons in 2007, then increased to 18.0 million tons<br />
globally in 2008. The 2.6% increase from 2006 to 2007 was in part due to a recovery in Chinese demand which reflected re-stocking<br />
throughout the whole supply chain following de-stocking in 2006, and the country’s ongoing urbanization and infrastructure development as<br />
well as the continual demand for copper intensive products on the back of rising incomes. These last two factors were also responsible for<br />
supporting double digit growth in <strong>India</strong>n demand during 2007. This consumption growth was slightly offset by a decline in demand growth in<br />
Western Europe by 6.7% and Japanese consumption by 3.0% due to a general slowdown in these economies. Consumption increased<br />
marginally to 18.0 million tons in 2008. In 2008, renewed demand in China and <strong>India</strong>, increased by 9.0% and 5.2%, respectively, was partially<br />
offset by a decline in demand in Western Europe and Japan, which decreased by 6.8% and 5.4 %, respectively, due to a slowdown in these<br />
economies.<br />
Asia (including the Middle East), Western Europe and North America together accounted for 86% of global copper consumption in 2008.<br />
Europe and North America accounted for over 60% of copper consumption during the 1980s, but strong growth in Asia, led by China and<br />
Japan, has since significantly changed global consumption patterns. With a compound annual growth rate of 7.2% between 2003 and 2007,<br />
Asia has been the fastest growing copper market in the world. Strong growth in Asia (including the Middle East), Russia and the<br />
Commonwealth of Independent States, or CIS, and Eastern European countries is expected from 2011 onwards following a recovery in demand<br />
from the current slowdown.<br />
The following table sets forth the regional consumption pattern of refined copper from 2005 to 2008:<br />
Year Ended December 31,<br />
2005 2006 2007 2008<br />
Region Volume % Volume % Volume % Volume %<br />
(thousands of tons, except percentages)<br />
Rest of Asia (1) 4,171 24.6% 4,246 24.3% 4,182 23.3% 4,153 23.1%<br />
Western Europe 3,565 21.0 3,923 22.4 3,661 20.4 3,413 19.0<br />
China 3,815 22.5 3,967 22.7 4,600 25.7 5,014 27.9<br />
North America 2,549 15.0 2,408 13.8 2,395 13.4 2,200 12.2<br />
CEE (2) and CIS 1,106 6.5 1,210 6.9 1,251 7.0 1,240 6.9<br />
Latin America 955 5.6 895 5.1 863 4.8 906 5.0<br />
<strong>India</strong> 415 2.4 458 2.6 568 3.2 598 3.3<br />
Africa 234 1.4 243 1.4 275 1.5 295 1.6<br />
Oceania 155 0.9 143 0.8 148 0.8 144 0.8<br />
Total 16,965 100.0% 17,493 100.0% 17,943 100.0% 17,963 100.0%<br />
Notes:<br />
(1) Rest of Asia is Asia excluding China and <strong>India</strong>, but including the Middle East.<br />
(2) Central and Eastern Europe.<br />
Source: Brook Hunt Copper Metal Service Report, May 2009.<br />
Copper Supply<br />
Global mine production is the principal source of copper, with scrap recycling accounting for only a minor part of the aggregate supplies.<br />
The five largest copper mining countries were Chile (34.4%), the United States (8.6%), Peru (7.9%), China (6.1%) and Australia (5.7%), which<br />
together accounted for approximately 63% of the total copper mined worldwide in 2008. Less than 50% of global copper mine production is<br />
integrated, with the remainder sold in the custom smelting market. The five largest copper mining companies in 2008 were Corporación<br />
Nacional del Cobre, Chile, or Codelco, Freeport-McMoRan, BHP Billiton <strong>Limited</strong>, or BHP Billiton, Xstrata AG, or Xstrata, and Rio Tinto<br />
Alcan <strong>Ltd</strong>, or Rio Tinto.<br />
The major smelting locations include China (20.4%), Japan (10.7%), Chile (10.6%), Russia (5.2%) and <strong>India</strong> (4.8%), which together<br />
accounted for 51.7% of global production and thus are major importers of copper concentrate in 2008. The five largest refined copper<br />
producing countries were China (20.6%), Chile (16.7%), Japan (8.4%), the United States (7.1%) and Russia (4.8%), which together accounted<br />
for about 57.4% of the total copper produced worldwide in 2008. The five largest copper smelting companies in 2008 were Codelco, Xstrata,<br />
Aurubis AG, Nippon Mining and Metals Co. <strong>Ltd</strong> and Freeport-McMoran, while the five largest copper refining companies in 2008 were<br />
Codelco, Freeport-McMoran, Aurubis AG, Xstrata, and Nippon Mining Metals Co. <strong>Ltd</strong>.<br />
Global refined copper production increased from 17.3 million tons in 2006 to 18.0 million tons in 2007, an increase of 4.1%, and to<br />
18.4 million tons in 2008, an increase of 2.0% over 2007. There was a production surplus over consumption during 2007 and 2008.<br />
3


