2011 EMC Directory & Design Guide - Interference Technology
2011 EMC Directory & Design Guide - Interference Technology
2011 EMC Directory & Design Guide - Interference Technology

You also want an ePaper? Increase the reach of your titles
YUMPU automatically turns print PDFs into web optimized ePapers that Google loves.
H o f f m a nn, Br aun, Frech, Rus s e r<br />
filters<br />
Transform (FFT) and weighted by digital<br />
detectors like peak, quasi-peak, average or<br />
rms. The calculated amplitude spectrum<br />
is displayed.<br />
<br />
<br />
<br />
<br />
<br />
Spectral Estimation<br />
Discrete spectral estimation is performed<br />
by the Discrete-Fourier-Transform (DFT).<br />
A fast algorithm for the computation<br />
of the DFT is the FFT. The FFT exploits<br />
symmetry and repetition properties and<br />
is defined as [7]<br />
X[k] =<br />
N−1<br />
∑<br />
n=0<br />
x[n]e −j2πkn<br />
N ,<br />
<br />
<br />
where X[k] is the discrete amplitude spectrum of the discrete<br />
time signal x[n].<br />
The Short-Time-Fast-Fourier-Transform (STFFT) is<br />
defined as an FFT over a limited time-interval. A Gaussian<br />
window function w[n] is applied, corresponding to<br />
the IF-filter of a conventional measurement receiver. By<br />
application of the STFFT, a spectrogram is calculated. The<br />
spectrogram is a FFT of a time-interval of the sampled timedomain<br />
signal. It depends on the discrete time coordinate<br />
of the window and the discrete frequency k. The STFFT is<br />
calculated by [7]<br />
X[τ, k] =<br />
N−1<br />
∑<br />
n=0<br />
x[n + τ]w[n]e −j2πkn<br />
N .<br />
(1)<br />
(2)<br />
<br />
<br />
<br />
<br />
<br />
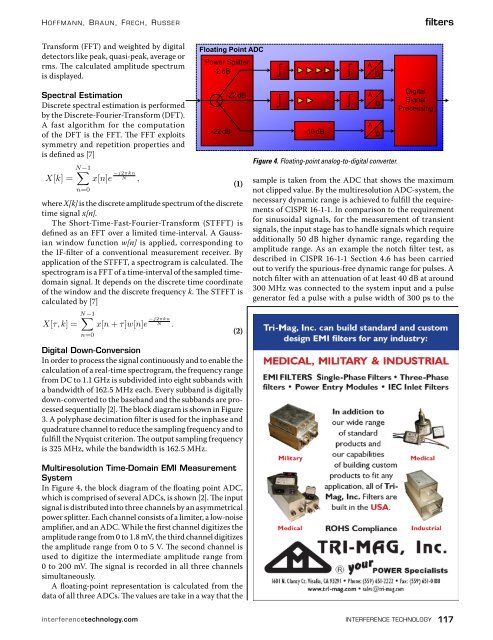
Figure 4. Floating-point analog-to-digital converter.<br />
<br />
<br />
<br />
sample is taken from the ADC that shows the maximum<br />
not clipped value. By the multiresolution ADC-system, the<br />
necessary dynamic range is achieved to fulfill the requirements<br />
of CISPR 16-1-1. In comparison to the requirement<br />
for sinusoidal signals, for the measurement of transient<br />
signals, the input stage has to handle signals which require<br />
additionally 50 dB higher dynamic range, regarding the<br />
amplitude range. As an example the notch filter test, as<br />
described in CISPR 16-1-1 Section 4.6 has been carried<br />
out to verify the spurious-free dynamic range for pulses. A<br />
notch filter with an attenuation of at least 40 dB at around<br />
300 MHz was connected to the system input and a pulse<br />
generator fed a pulse with a pulse width of 300 ps to the<br />
Digital Down-Conversion<br />
In order to process the signal continuously and to enable the<br />
calculation of a real-time spectrogram, the frequency range<br />
from DC to 1.1 GHz is subdivided into eight subbands with<br />
a bandwidth of 162.5 MHz each. Every subband is digitally<br />
down-converted to the baseband and the subbands are processed<br />
sequentially [2]. The block diagram is shown in Figure<br />
3. A polyphase decimation filter is used for the inphase and<br />
quadrature channel to reduce the sampling frequency and to<br />
fulfill the Nyquist criterion. The output sampling frequency<br />
is 325 MHz, while the bandwidth is 162.5 MHz.<br />
Multiresolution Time-Domain EMI Measurement<br />
System<br />
In Figure 4, the block diagram of the floating point ADC,<br />
which is comprised of several ADCs, is shown [2]. The input<br />
signal is distributed into three channels by an asymmetrical<br />
power splitter. Each channel consists of a limiter, a low-noise<br />
amplifier, and an ADC. While the first channel digitizes the<br />
amplitude range from 0 to 1.8 mV, the third channel digitizes<br />
the amplitude range from 0 to 5 V. The second channel is<br />
used to digitize the intermediate amplitude range from<br />
0 to 200 mV. The signal is recorded in all three channels<br />
simultaneously.<br />
A floating-point representation is calculated from the<br />
data of all three ADCs. The values are take in a way that the<br />
interferencetechnology.com interference technology 117


![[ thursday ] morning sessions 8:30 am-noon - Interference Technology](https://img.yumpu.com/23176841/1/190x247/-thursday-morning-sessions-830-am-noon-interference-technology.jpg?quality=85)