2011 EMC Directory & Design Guide - Interference Technology
2011 EMC Directory & Design Guide - Interference Technology
2011 EMC Directory & Design Guide - Interference Technology

You also want an ePaper? Increase the reach of your titles
YUMPU automatically turns print PDFs into web optimized ePapers that Google loves.
adiated emissions<br />
G o ing from A n a l o g t o Digi ta l<br />
data record of emissions traces that the system creates when<br />
a survey or set of emissions measurements is carried out.<br />
This type of emissions record keeping will be beneficial<br />
when EPRI develops an on-line emissions database. Such<br />
a database can provide researchers and customers with<br />
access to historical and recent emissions data. Data from<br />
past surveys may even be converted to digital data which<br />
can be uploaded to the database.<br />
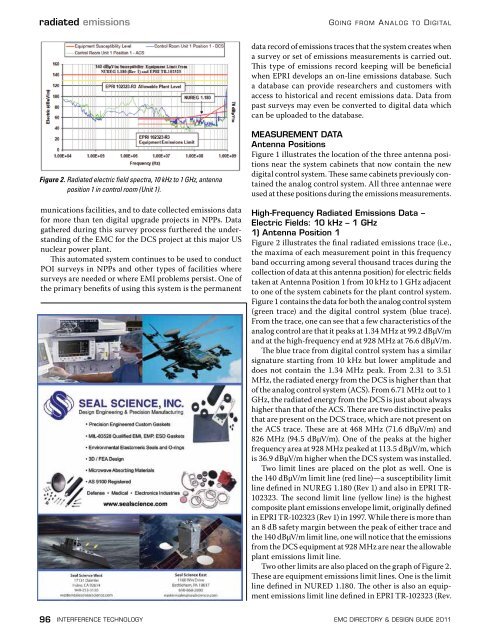
Figure 2. Radiated electric field spectra, 10 kHz to 1 GHz, antenna<br />
position 1 in control room (Unit 1).<br />
munications facilities, and to date collected emissions data<br />
for more than ten digital upgrade projects in NPPs. Data<br />
gathered during this survey process furthered the understanding<br />
of the <strong>EMC</strong> for the DCS project at this major US<br />
nuclear power plant.<br />
This automated system continues to be used to conduct<br />
POI surveys in NPPs and other types of facilities where<br />
surveys are needed or where EMI problems persist. One of<br />
the primary benefits of using this system is the permanent<br />
MEASUREMENT DATA<br />
Antenna Positions<br />
Figure 1 illustrates the location of the three antenna positions<br />
near the system cabinets that now contain the new<br />
digital control system. These same cabinets previously contained<br />
the analog control system. All three antennae were<br />
used at these positions during the emissions measurements.<br />
High-Frequency Radiated Emissions Data –<br />
Electric Fields: 10 kHz – 1 GHz<br />
1) Antenna Position 1<br />
Figure 2 illustrates the final radiated emissions trace (i.e.,<br />
the maxima of each measurement point in this frequency<br />
band occurring among several thousand traces during the<br />
collection of data at this antenna position) for electric fields<br />
taken at Antenna Position 1 from 10 kHz to 1 GHz adjacent<br />
to one of the system cabinets for the plant control system.<br />
Figure 1 contains the data for both the analog control system<br />
(green trace) and the digital control system (blue trace).<br />
From the trace, one can see that a few characteristics of the<br />
analog control are that it peaks at 1.34 MHz at 99.2 dBμV/m<br />
and at the high-frequency end at 928 MHz at 76.6 dBμV/m.<br />
The blue trace from digital control system has a similar<br />
signature starting from 10 kHz but lower amplitude and<br />
does not contain the 1.34 MHz peak. From 2.31 to 3.51<br />
MHz, the radiated energy from the DCS is higher than that<br />
of the analog control system (ACS). From 6.71 MHz out to 1<br />
GHz, the radiated energy from the DCS is just about always<br />
higher than that of the ACS. There are two distinctive peaks<br />
that are present on the DCS trace, which are not present on<br />
the ACS trace. These are at 468 MHz (71.6 dBμV/m) and<br />
826 MHz (94.5 dBμV/m). One of the peaks at the higher<br />
frequency area at 928 MHz peaked at 113.5 dBμV/m, which<br />
is 36.9 dBμV/m higher when the DCS system was installed.<br />
Two limit lines are placed on the plot as well. One is<br />
the 140 dBμV/m limit line (red line)—a susceptibility limit<br />
line defined in NUREG 1.180 (Rev 1) and also in EPRI TR-<br />
102323. The second limit line (yellow line) is the highest<br />
composite plant emissions envelope limit, originally defined<br />
in EPRI TR-102323 (Rev 1) in 1997. While there is more than<br />
an 8 dB safety margin between the peak of either trace and<br />
the 140 dBμV/m limit line, one will notice that the emissions<br />
from the DCS equipment at 928 MHz are near the allowable<br />
plant emissions limit line.<br />
Two other limits are also placed on the graph of Figure 2.<br />
These are equipment emissions limit lines. One is the limit<br />
line defined in NURED 1.180. The other is also an equipment<br />
emissions limit line defined in EPRI TR-102323 (Rev.<br />
96 interference technology emc <strong>Directory</strong> & design guide <strong>2011</strong>


![[ thursday ] morning sessions 8:30 am-noon - Interference Technology](https://img.yumpu.com/23176841/1/190x247/-thursday-morning-sessions-830-am-noon-interference-technology.jpg?quality=85)