The Risk of the Outflow of Doctors and IT/ICT ... - Outlook Web App
The Risk of the Outflow of Doctors and IT/ICT ... - Outlook Web App
The Risk of the Outflow of Doctors and IT/ICT ... - Outlook Web App

Create successful ePaper yourself
Turn your PDF publications into a flip-book with our unique Google optimized e-Paper software.
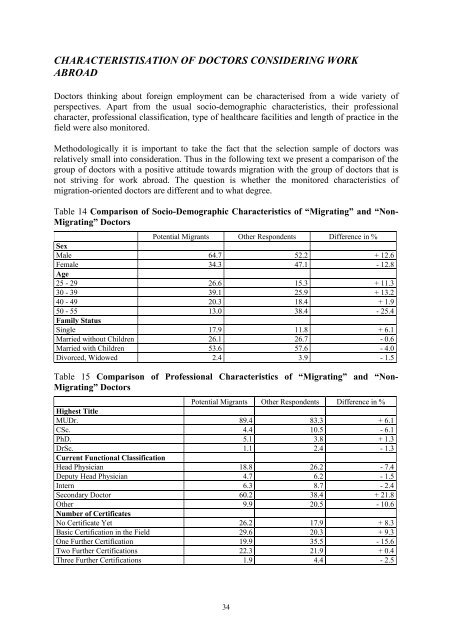
CHARACTERISTISATION OF DOCTORS CONSIDERING WORK<br />
ABROAD<br />
<strong>Doctors</strong> thinking about foreign employment can be characterised from a wide variety <strong>of</strong><br />
perspectives. Apart from <strong>the</strong> usual socio-demographic characteristics, <strong>the</strong>ir pr<strong>of</strong>essional<br />
character, pr<strong>of</strong>essional classification, type <strong>of</strong> healthcare facilities <strong>and</strong> length <strong>of</strong> practice in <strong>the</strong><br />
field were also monitored.<br />
Methodologically it is important to take <strong>the</strong> fact that <strong>the</strong> selection sample <strong>of</strong> doctors was<br />
relatively small into consideration. Thus in <strong>the</strong> following text we present a comparison <strong>of</strong> <strong>the</strong><br />
group <strong>of</strong> doctors with a positive attitude towards migration with <strong>the</strong> group <strong>of</strong> doctors that is<br />
not striving for work abroad. <strong>The</strong> question is whe<strong>the</strong>r <strong>the</strong> monitored characteristics <strong>of</strong><br />
migration-oriented doctors are different <strong>and</strong> to what degree.<br />
Table 14 Comparison <strong>of</strong> Socio-Demographic Characteristics <strong>of</strong> “Migrating” <strong>and</strong> “Non-<br />
Migrating” <strong>Doctors</strong><br />
Potential Migrants O<strong>the</strong>r Respondents Difference in %<br />
Sex<br />
Male 64.7 52.2 + 12.6<br />
Female 34.3 47.1 - 12.8<br />
Age<br />
25 - 29 26.6 15.3 + 11.3<br />
30 - 39 39.1 25.9 + 13.2<br />
40 - 49 20.3 18.4 + 1.9<br />
50 - 55 13.0 38.4 - 25.4<br />
Family Status<br />
Single 17.9 11.8 + 6.1<br />
Married without Children 26.1 26.7 - 0.6<br />
Married with Children 53.6 57.6 - 4.0<br />
Divorced, Widowed 2.4 3.9 - 1.5<br />
Table 15 Comparison <strong>of</strong> Pr<strong>of</strong>essional Characteristics <strong>of</strong> “Migrating” <strong>and</strong> “Non-<br />
Migrating” <strong>Doctors</strong><br />
Potential Migrants O<strong>the</strong>r Respondents Difference in %<br />
Highest Title<br />
MUDr. 89.4 83.3 + 6.1<br />
CSc. 4.4 10.5 - 6.1<br />
PhD. 5.1 3.8 + 1.3<br />
DrSc. 1.1 2.4 - 1.3<br />
Current Functional Classification<br />
Head Physician 18.8 26.2 - 7.4<br />
Deputy Head Physician 4.7 6.2 - 1.5<br />
Intern 6.3 8.7 - 2.4<br />
Secondary Doctor 60.2 38.4 + 21.8<br />
O<strong>the</strong>r 9.9 20.5 - 10.6<br />
Number <strong>of</strong> Certificates<br />
No Certificate Yet 26.2 17.9 + 8.3<br />
Basic Certification in <strong>the</strong> Field 29.6 20.3 + 9.3<br />
One Fur<strong>the</strong>r Certification 19.9 35.5 - 15.6<br />
Two Fur<strong>the</strong>r Certifications 22.3 21.9 + 0.4<br />
Three Fur<strong>the</strong>r Certifications 1.9 4.4 - 2.5<br />
34