Database - United Nations in Bangladesh
Database - United Nations in Bangladesh
Database - United Nations in Bangladesh

Create successful ePaper yourself
Turn your PDF publications into a flip-book with our unique Google optimized e-Paper software.
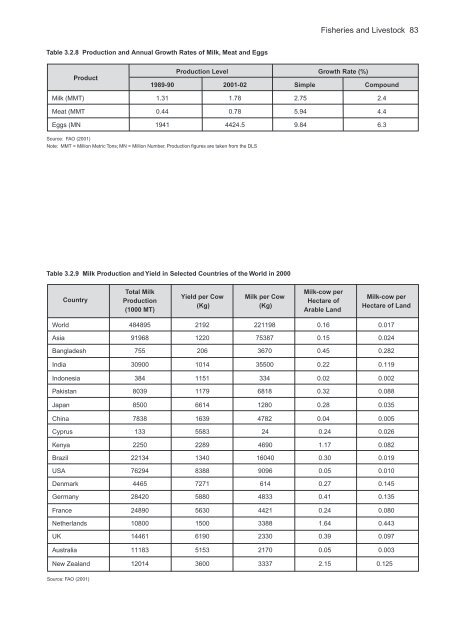
Fisheries and Livestock 83<br />
Table 3.2.8 Production and Annual Growth Rates of Milk, Meat and Eggs<br />
Product<br />
Production Level Growth Rate (%)<br />
1989-90 2001-02 Simple Compound<br />
Milk (MMT) 1.31 1.78 2.75 2.4<br />
Meat (MMT 0.44 0.78 5.94 4.4<br />
Eggs (MN 1941 4424.5 9.84 6.3<br />
Source: FAO (2001)<br />
Note: MMT = Million Metric Tons; MN = Million Number. Production figures are taken from the DLS<br />
Table 3.2.9 Milk Production and Yield <strong>in</strong> Selected Countries of the World <strong>in</strong> 2000<br />
Country<br />
Total Milk<br />
Milk-cow per<br />
Yield per Cow Milk per Cow<br />
Production<br />
Hectare of<br />
(Kg)<br />
(Kg)<br />
(1000 MT) Arable Land<br />
Milk-cow per<br />
Hectare of Land<br />
World 484895 2192 221198 0.16 0.017<br />
Asia 91968 1220 75387 0.15 0.024<br />
<strong>Bangladesh</strong> 755 206 3670 0.45 0.282<br />
India 30900 1014 35500 0.22 0.119<br />
Indonesia 384 1151 334 0.02 0.002<br />
Pakistan 8039 1179 6818 0.32 0.088<br />
Japan 8500 6614 1280 0.28 0.035<br />
Ch<strong>in</strong>a 7838 1639 4782 0.04 0.005<br />
Cyprus 133 5583 24 0.24 0.026<br />
Kenya 2250 2289 4690 1.17 0.082<br />
Brazil 22134 1340 16040 0.30 0.019<br />
USA 76294 8388 9096 0.05 0.010<br />
Denmark 4465 7271 614 0.27 0.145<br />
Germany 28420 5880 4833 0.41 0.135<br />
France 24890 5630 4421 0.24 0.080<br />
Netherlands 10800 1500 3388 1.64 0.443<br />
UK 14461 6190 2330 0.39 0.097<br />
Australia 11183 5153 2170 0.05 0.003<br />
New Zealand 12014 3600 3337 2.15 0.125<br />
Source: FAO (2001)