Ageing in the Twenty-First Century: - HelpAge International
Ageing in the Twenty-First Century: - HelpAge International
Ageing in the Twenty-First Century: - HelpAge International

You also want an ePaper? Increase the reach of your titles
YUMPU automatically turns print PDFs into web optimized ePapers that Google loves.
Discussions with older people <strong>in</strong> South Africa, for<br />
example, showed that <strong>the</strong>y associated old age both with<br />
experience ga<strong>in</strong>ed <strong>in</strong> life and <strong>in</strong>creas<strong>in</strong>g dependence<br />
on o<strong>the</strong>rs. Chronological def<strong>in</strong>itions of old age were not<br />
viewed as so important <strong>in</strong> signify<strong>in</strong>g old age as changes<br />
<strong>in</strong> physical and mental capacity. 5<br />
Older persons are a highly diverse population group,<br />
<strong>in</strong> terms of, for example, age, sex, ethnicity, education,<br />
<strong>in</strong>come and health. It is important to recognize this<br />
<strong>in</strong> order to adequately address <strong>the</strong> needs of all older<br />
persons, especially <strong>the</strong> most vulnerable.<br />
Why is <strong>the</strong> world age<strong>in</strong>g?<br />
Population age<strong>in</strong>g is occurr<strong>in</strong>g because of decl<strong>in</strong><strong>in</strong>g<br />
fertility rates, lower <strong>in</strong>fant mortality and <strong>in</strong>creas<strong>in</strong>g<br />
survival at older ages. Total fertility dropped by half<br />
from five children per woman <strong>in</strong> 1950-1955 to 2.5 children<br />
<strong>in</strong> 2010-2015, and it is expected to cont<strong>in</strong>ue to decl<strong>in</strong>e.<br />
Life expectancy at birth has risen substantially across<br />
<strong>the</strong> world; it is not just a developed world phenomenon.<br />
In 2010-2015, life expectancy is 78 years <strong>in</strong> developed<br />
countries and 68 years <strong>in</strong> develop<strong>in</strong>g regions. By<br />
2045-2050, newborns can expect to live to 83 years <strong>in</strong><br />
developed regions and 74 years <strong>in</strong> develop<strong>in</strong>g regions.<br />
While overall <strong>the</strong> world is age<strong>in</strong>g, <strong>the</strong>re are differences<br />
<strong>in</strong> <strong>the</strong> speed of population age<strong>in</strong>g. It is happen<strong>in</strong>g fastest<br />
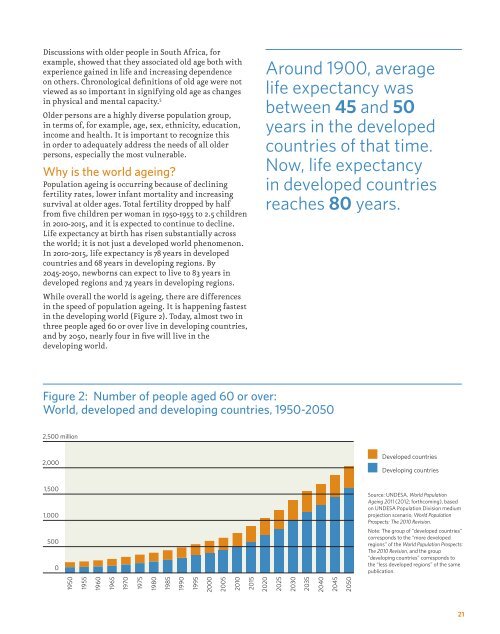
<strong>in</strong> <strong>the</strong> develop<strong>in</strong>g world (Figure 2). Today, almost two <strong>in</strong><br />
three people aged 60 or over live <strong>in</strong> develop<strong>in</strong>g countries,<br />
and by 2050, nearly four <strong>in</strong> five will live <strong>in</strong> <strong>the</strong><br />
develop<strong>in</strong>g world.<br />
Around 1900, average<br />
life expectancy was<br />
between 45 and 50<br />
years <strong>in</strong> <strong>the</strong> developed<br />
countries of that time.<br />
Now, life expectancy<br />
<strong>in</strong> developed countries<br />
reaches 80 years.<br />
gure 2: Number of people aged 60 or over: World, developed and develop<strong>in</strong>g countries, 1950-2050<br />
Figure 2: Number of people aged 60 or over:<br />
World, developed and develop<strong>in</strong>g countries, 1950-2050<br />
2,500 million<br />
2,000<br />
Developed countries<br />
Develop<strong>in</strong>g countries<br />
1,500<br />
1,000<br />
500<br />
0<br />
Source: UNDESA, World Population<br />
<strong>Age<strong>in</strong>g</strong> 2011 (2012; Developed forthcom<strong>in</strong>g), countries based<br />
on UNDESA Population Division medium<br />
projection scenario, Develop<strong>in</strong>g World Population countries<br />
Prospects: The 2010 Revision.<br />
Note: The group of “developed countries”<br />
corresponds Source: UNDESA, to <strong>the</strong> World “more Population developed <strong>Age<strong>in</strong>g</strong> 2011 (2012; forthcom<strong>in</strong>g)<br />
based on UNDESA Population Division medium projection scenario<br />
regions” of <strong>the</strong> World Population Prospects:<br />
World Population Prospects: The 2010 Revision.<br />
The 2010 Revision, and <strong>the</strong> group<br />
Note: The group of “developed countries” corresponds to <strong>the</strong> “more<br />
“develop<strong>in</strong>g countries” corresponds to<br />
developed regions” of <strong>the</strong> World Population Prospects: The 2010<br />
<strong>the</strong> “less Revision, developed and <strong>the</strong> group regions” “develop<strong>in</strong>g of <strong>the</strong> countries” same corresponds to <strong>the</strong><br />
publication. “less developed regions” of <strong>the</strong> same publication.<br />
1950<br />
1955<br />
1960<br />
1965<br />
1970<br />
1975<br />
1980<br />
1985<br />
1990<br />
1995<br />
2000<br />
2005<br />
2010<br />
2015<br />
2020<br />
2025<br />
2030<br />
2035<br />
2040<br />
2045<br />
2050<br />
21