Smalltalk and Object Orientation: an Introduction - Free
Smalltalk and Object Orientation: an Introduction - Free
Smalltalk and Object Orientation: an Introduction - Free

You also want an ePaper? Increase the reach of your titles
YUMPU automatically turns print PDFs into web optimized ePapers that Google loves.
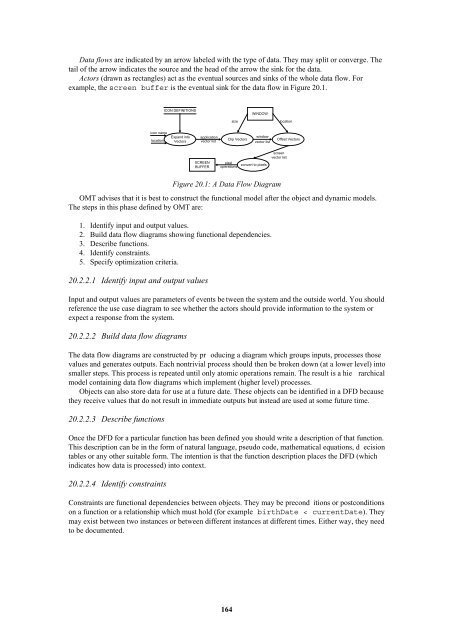
Data flows are indicated by <strong>an</strong> arrow labeled with the type of data. They may split or converge. The<br />
tail of the arrow indicates the source <strong><strong>an</strong>d</strong> the head of the arrow the sink for the data.<br />
Actors (drawn as rect<strong>an</strong>gles) act as the eventual sources <strong><strong>an</strong>d</strong> sinks of the whole data flow. For<br />
example, the screen buffer is the eventual sink for the data flow in Figure 20.1.<br />
ICON DEFINITIONS<br />
WINDOW<br />
size<br />
location<br />
icon name<br />
location<br />
Exp<strong><strong>an</strong>d</strong> into<br />
Vectors<br />
application<br />
vector list<br />
Clip Vectors<br />
window<br />
vector list<br />
Offset Vectors<br />
SCREEN<br />
BUFFER<br />
pixel<br />
operations<br />
convert to pixels<br />
screen<br />
vector list<br />
Figure 20.1: A Data Flow Diagram<br />
OMT advises that it is best to construct the functional model after the object <strong><strong>an</strong>d</strong> dynamic models.<br />
The steps in this phase defined by OMT are:<br />
1. Identify input <strong><strong>an</strong>d</strong> output values.<br />
2. Build data flow diagrams showing functional dependencies.<br />
3. Describe functions.<br />
4. Identify constraints.<br />
5. Specify optimization criteria.<br />
20.2.2.1 Identify input <strong><strong>an</strong>d</strong> output values<br />
Input <strong><strong>an</strong>d</strong> output values are parameters of events be tween the system <strong><strong>an</strong>d</strong> the outside world. You should<br />
reference the use case diagram to see whether the actors should provide information to the system or<br />
expect a response from the system.<br />
20.2.2.2 Build data flow diagrams<br />
The data flow diagrams are constructed by pr oducing a diagram which groups inputs, processes those<br />
values <strong><strong>an</strong>d</strong> generates outputs. Each nontrivial process should then be broken down (at a lower level) into<br />
smaller steps. This process is repeated until only atomic operations remain. The result is a hie rarchical<br />
model containing data flow diagrams which implement (higher level) processes.<br />
<strong>Object</strong>s c<strong>an</strong> also store data for use at a future date. These objects c<strong>an</strong> be identified in a DFD because<br />
they receive values that do not result in immediate outputs but instead are used at some future time.<br />
20.2.2.3 Describe functions<br />
Once the DFD for a particular function has been defined you should write a description of that function.<br />
This description c<strong>an</strong> be in the form of natural l<strong>an</strong>guage, pseudo code, mathematical equations, d ecision<br />
tables or <strong>an</strong>y other suitable form. The intention is that the function description places the DFD (which<br />
indicates how data is processed) into context.<br />
20.2.2.4 Identify constraints<br />
Constraints are functional dependencies between objects. They may be precond itions or postconditions<br />
on a function or a relationship which must hold (for example birthDate < currentDate). They<br />
may exist between two inst<strong>an</strong>ces or between different inst<strong>an</strong>ces at different times. Either way, they need<br />
to be documented.<br />
164