National Healthcare Disparities Report - LDI Health Economist
National Healthcare Disparities Report - LDI Health Economist
National Healthcare Disparities Report - LDI Health Economist

Create successful ePaper yourself
Turn your PDF publications into a flip-book with our unique Google optimized e-Paper software.
Effectiveness of Care<br />
Chapter 2 Respiratory Diseases<br />
n From 2003 to 2008, the percentage of people with current asthma who reported taking preventive<br />
asthma medicine daily or almost daily did not change significantly (data not shown). A significant<br />
decline was observed among Blacks and people with any college education. No change was<br />
observed among other racial/ethnic or education groups (Figure 2.42).<br />
n In 3 of 6 years, non-Hispanics Blacks were less likely to take daily preventive asthma medicine than<br />
non-Hispanic Whites.<br />
Also, in the NHQR:<br />
n From 2003 to 2008, people ages 18-44 were less likely than other age groups to take daily preventive<br />
asthma medicine.<br />
n Uninsured people under age 65 were less likely than people under age 65 with any private health<br />
insurance to take daily preventive asthma medicine.<br />
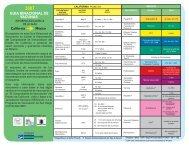
Focus on Asian and Hispanic Subgroups<br />
<strong>National</strong> data on Asian and Hispanic subgroups are limited. In this section, we show rates of daily asthma<br />
medicine use among Asian and Hispanic subgroups in California. Data come from the 2009 California<br />
<strong>Health</strong> Interview Survey, which asks about daily medication to control asthma, similar to the Medical<br />
Expenditure Panel Survey question presented above.<br />
Figure 2.43. People with current asthma who report taking prescription medication to control asthma, by<br />
Asian and Hispanic subgroups and English proficiency, California, 2009<br />
75<br />
75<br />
50<br />
50<br />
Percent<br />
Percent<br />
25<br />
25<br />
0<br />
California Total<br />
Asian Total<br />
Vietnamese<br />
South Asian<br />
Well/Very Well<br />
Not Well/Not at All<br />
0<br />
California Total<br />
Hispanic Total<br />
Central American<br />
Mexican<br />
English at Home<br />
Well/Very Well<br />
Not Well/Not at All<br />
Source: UCLA, Center for <strong>Health</strong> Policy Research, California <strong>Health</strong> Interview Survey, 2009.<br />
Denominator: Civilian noninstitutionalized population in California.<br />
Note: Estimates for Asians who speak English at home were not statistically reliable.<br />
108 <strong>National</strong> <strong><strong>Health</strong>care</strong> <strong>Disparities</strong> <strong>Report</strong>, 2011