National Healthcare Disparities Report - LDI Health Economist
National Healthcare Disparities Report - LDI Health Economist
National Healthcare Disparities Report - LDI Health Economist

Create successful ePaper yourself
Turn your PDF publications into a flip-book with our unique Google optimized e-Paper software.
Care Coordination<br />
n From 2002 to 2008, the percentage of people with a usual source of care whose health provider<br />
usually asked about prescription medications and treatments from other doctors improved from 75%<br />
to 81% (data not shown).<br />
n Improvements were observed among all racial and disability groups (Figure 6.5).<br />
n In 2008, the percentage of patients with a usual source of care whose health provider usually asked<br />
about prescription medications and treatments from other doctors was significantly lower for Asians<br />
than for Whites (74% compared with 81%).<br />
Also, in the NHQR:<br />
n From 2002 to 2008, children’s health providers were less likely to ask about medications from other<br />
doctors. In all years except 2003, the health providers of older adults were also less likely to ask<br />
about medications from other doctors.<br />
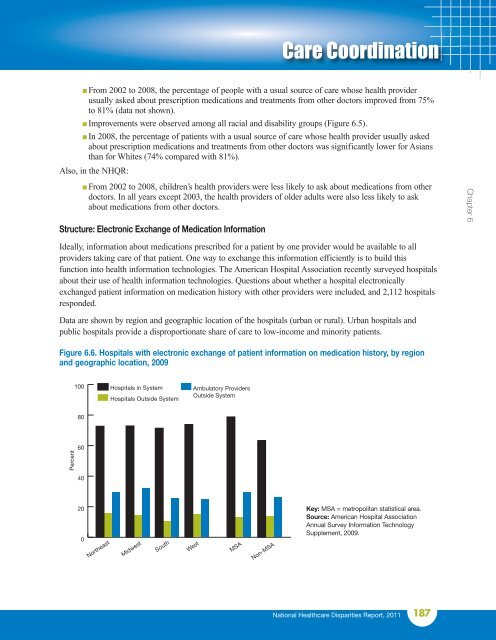
Structure: Electronic Exchange of Medication Information<br />
Chapter 6<br />
Ideally, information about medications prescribed for a patient by one provider would be available to all<br />
providers taking care of that patient. One way to exchange this information efficiently is to build this<br />
function into health information technologies. The American Hospital Association recently surveyed hospitals<br />
about their use of health information technologies. Questions about whether a hospital electronically<br />
exchanged patient information on medication history with other providers were included, and 2,112 hospitals<br />
responded.<br />
Data are shown by region and geographic location of the hospitals (urban or rural). Urban hospitals and<br />
public hospitals provide a disproportionate share of care to low-income and minority patients.<br />
Figure 6.6. Hospitals with electronic exchange of patient information on medication history, by region<br />
and geographic location, 2009<br />
100<br />
Hospitals in System<br />
Hospitals Outside System<br />
Ambulatory Providers<br />
Outside System<br />
80<br />
Percent<br />
60<br />
40<br />
20<br />
0<br />
Northeast<br />
Midwest<br />
South<br />
West<br />
MSA<br />
Non-MSA<br />
Key: MSA = metropolitan statistical area.<br />
Source: American Hospital Association<br />
Annual Survey Information Technology<br />
Supplement, 2009.<br />
<strong>National</strong> <strong><strong>Health</strong>care</strong> <strong>Disparities</strong> <strong>Report</strong>, 2011<br />
187