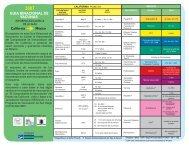
National Healthcare Disparities Report - LDI Health Economist
National Healthcare Disparities Report - LDI Health Economist
National Healthcare Disparities Report - LDI Health Economist

Create successful ePaper yourself
Turn your PDF publications into a flip-book with our unique Google optimized e-Paper software.
Effectiveness of Care<br />
Figure 2.2. Age-adjusted rate of advanced stage breast cancer per 100,000 women age 40 and over, by<br />
race and ethnicity, 2000-2007<br />
125<br />
White<br />
Black<br />
AI/AN<br />
API<br />
125<br />
Non-Hispanic White<br />
Hispanic<br />
100<br />
100<br />
Rate per 100,000 Population<br />
75<br />
50<br />
25<br />
2007 Achievable Benchmark: 79<br />
Rate per 100,000 Population<br />
75<br />
50<br />
25<br />
2007 Achievable Benchmark: 79<br />
Chapter 2 Cancer<br />
0<br />
2000<br />
2001<br />
2002<br />
2003<br />
2004<br />
2005<br />
2006<br />
2007<br />
0<br />
2000<br />
2001<br />
2002<br />
2003<br />
2004<br />
2005<br />
2006<br />
2007<br />
Key: AI/AN = American Indian or Alaska Native; API = Asian or Pacific Islander.<br />
Source: Centers for Disease Control and Prevention, <strong>National</strong> Program of Cancer Registries and <strong>National</strong> Cancer Institute,<br />
Surveillance, Epidemiology, and End Results (SEER) Program, 2000-2007. Registries meeting United States Cancer Statistics<br />
publication criteria for every year, 2000-2007, are included and cover 89.3% of the total U.S. population. States excluded are DC,<br />
Mississippi, Nevada, North Carolina, South Dakota, Tennessee, and Virginia.<br />
Denominator: Women age 40 and over.<br />
Note: For this measure, lower rates are better. Age adjusted to the 2000 U.S. standard population. Advanced stage breast cancer is<br />
defined as local stage with tumor size greater than 2 cm diameter, regional stage or distant stage.<br />
n From 2000 to 2007, the rate of advanced stage breast cancer in Black women increased from 99 to<br />
108 per 100,000 women. There were no statistically significant changes in rates among other racial<br />
and ethnic groups (Figure 2.2).<br />
n In all years, rates were lower among Asian or Pacific Islander (API) and American Indian or Alaska<br />
Native (AI/AN) women compared with White women and among Hispanic women compared with<br />
non-Hispanic White women. Since 2003, rates have been higher among Black women compared<br />
with White women.<br />
n The 2007 top 5 State achievable benchmark was 79 per 100,000 women. v AI/AN, API, and Hispanic<br />
women have achieved the benchmark while Black women are moving away from it.<br />
Also, in the NHQR:<br />
n In all years, women ages 50-64 and 65 and over had higher rates than women ages 40-49.<br />
v<br />
The top 5 States contributing to the achievable benchmark are Arizona, Florida, New Hampshire, West Virginia, and Wyoming.<br />
<strong>National</strong> <strong><strong>Health</strong>care</strong> <strong>Disparities</strong> <strong>Report</strong>, 2011<br />
53