National Healthcare Disparities Report - LDI Health Economist
National Healthcare Disparities Report - LDI Health Economist
National Healthcare Disparities Report - LDI Health Economist

Create successful ePaper yourself
Turn your PDF publications into a flip-book with our unique Google optimized e-Paper software.
Efficiency<br />
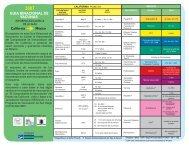
Figure 7.2. Potentially avoidable hospitalization rates, by race/ethnicity and area income, 2001-2008<br />
4000<br />
White<br />
Black<br />
API<br />
Hispanic<br />
4000<br />
First Quartile (Lowest Income)<br />
Second Quartile<br />
Third Quartile<br />
Fourth Quartile (Highest Income)<br />
Chapter 7<br />
Rate per 100,000 Population<br />
3000<br />
2000<br />
Rate per 100,000 Population<br />
3000<br />
2000<br />
1000<br />
2008 Achievable<br />
Benchmark: 818<br />
1000<br />
2008 Achievable<br />
Benchmark: 818<br />
0<br />
2001<br />
2002<br />
2003<br />
2004<br />
2005<br />
2006<br />
2007<br />
2008<br />
0<br />
2001<br />
2002<br />
2003<br />
2004<br />
2005<br />
2006<br />
2007<br />
2008<br />
Key: API = Asian or Pacific Islander.<br />
Source: Agency for <strong><strong>Health</strong>care</strong> Research and Quality (AHRQ), Center for Delivery, Organization, and Markets, <strong><strong>Health</strong>care</strong> Cost and<br />
Utilization Project, State Inpatient Databases disparities analysis file, Nationwide Inpatient Sample, and AHRQ Quality Indicators,<br />
modified version 4.1, 2001-2008.<br />
Denominator: Civilian noninstitutionalized adults age 18 and over.<br />
Note: For this measure, lower rates are better. Annual rates are adjusted for age and gender. White, Black, and Asian or Pacific<br />
Islander populations are non-Hispanic. Income quartiles are based on median income of ZIP Code of patient’s residence.<br />
n From 2001 to 2008, the overall rate of avoidable hospitalizations fell from 1,657 to 1,433 per<br />
100,000 population (data not shown). Declines in avoidable hospitalizations were observed among<br />
all raceial/ethnic and income groups (Figure 7.2).<br />
n In all years, rates of potentially avoidable hospitalizations were higher among Blacks compared with<br />
Whites and lower among Asians and Pacific Islanders (APIs) compared with Whites. Except in 2001<br />
and 2008, rates were also higher among Hispanics compared with Whites.<br />
n In all years, rates of potentially avoidable hospitalizations were higher among residents of areas in<br />
the lowest and second income quartiles compared with residents of the highest income quartile.<br />
n In 2008, the top 3 State achievable benchmark for all potentially avoidable hospitalizations was 818<br />
hospitalizations per 100,000. iii The overall achievable benchmark could not be attained for 20 years.<br />
n The only racial/ethnic group to attain the achievable benchmark as of 2008 was APIs, whereas<br />
Whites could not attain the benchmark for about 16 years. Blacks would not attain the benchmark<br />
for about 18 years, but Hispanics could attain the benchmark in 7 years.<br />
n High-income groups would attain the benchmark sooner than lower income groups (lowest quartile,<br />
about 41 years; second quartile, 15 years; third quartile, 14 years; and highest quartile, 9 years).<br />
iii<br />
The top 3 States that contributed to the achievable benchmark are Hawaii, Utah, and Washington.<br />
194 <strong>National</strong> <strong><strong>Health</strong>care</strong> <strong>Disparities</strong> <strong>Report</strong>, 2011