- Page 1: NATIONAL HEALTHCARE DISPARITIES REP
- Page 4 and 5: Acknowledgments The NHQR and NHDR a
- Page 6 and 7: National Healthcare Disparities Rep
- Page 8 and 9: Highlights New this year, the Highl
- Page 10 and 11: Highlights n Disparities in quality
- Page 12 and 13: Highlights n Quality is improving s
- Page 14 and 15: Highlights Figure H.6. Number and p
- Page 16 and 17: Highlights Table H.2. Quality measu
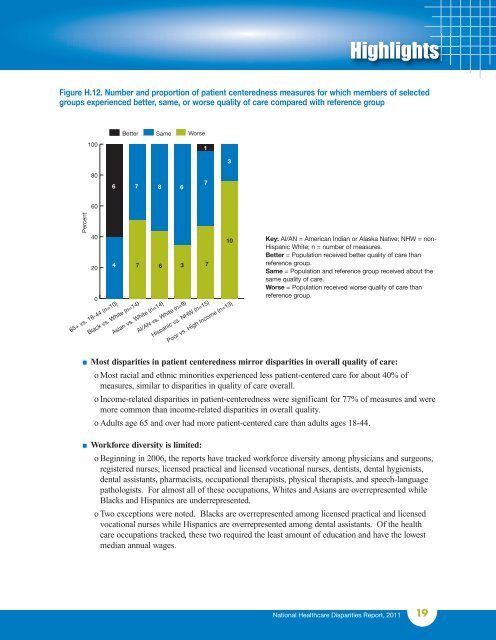
- Page 18 and 19: Highlights n Disparities also chang
- Page 20 and 21: Highlights Figure H.9. Income-relat
- Page 22 and 23: Highlights Progress in Patient Safe
- Page 26 and 27: Highlights Examples of Initiatives
- Page 28 and 29: Highlights Provider: When referring
- Page 30 and 31: Highlights State: The Ohio Plan To
- Page 32 and 33: Highlights Figure H.15. Number and
- Page 34 and 35: Highlights to have high health care
- Page 36 and 37: Highlights n Data on disparities ar
- Page 38 and 39: Highlights share experiences and di
- Page 40 and 41: Highlights References Andrulis DP,
- Page 42 and 43: Introduction and Methods With rapid
- Page 44 and 45: Introduction and Methods a new sect
- Page 46 and 47: Introduction and Methods Table 1.2.
- Page 48 and 49: Introduction and Methods antibiotic
- Page 50 and 51: Introduction and Methods Progress o
- Page 52 and 53: Introduction and Methods n Trends o
- Page 54 and 55: Introduction and Methods Reporting
- Page 56 and 57: Effectiveness of Care Cancer Import
- Page 58 and 59: Effectiveness of Care Chapter 2 Can
- Page 60 and 61: Effectiveness of Care Treatment: Re
- Page 62 and 63: Effectiveness of Care Also, in the
- Page 64 and 65: Effectiveness of Care Importance Ca
- Page 66 and 67: Effectiveness of Care Also, in the
- Page 68 and 69: Effectiveness of Care Chapter 2 Car
- Page 70 and 71: Effectiveness of Care Also, in the
- Page 72 and 73: Effectiveness of Care Chronic Kidne
- Page 74 and 75:
Effectiveness of Care Figure 2.13.
- Page 76 and 77:
Effectiveness of Care Diabetes Impo
- Page 78 and 79:
Effectiveness of Care Multivariate
- Page 80 and 81:
Effectiveness of Care Focus on Indi
- Page 82 and 83:
Effectiveness of Care HIV and AIDS
- Page 84 and 85:
Effectiveness of Care To normalize
- Page 86 and 87:
Effectiveness of Care HIV/AIDS core
- Page 88 and 89:
Effectiveness of Care Outcome: Deat
- Page 90 and 91:
Effectiveness of Care Findings NEW
- Page 92 and 93:
Effectiveness of Care Figure 2.25.
- Page 94 and 95:
Effectiveness of Care Figure 2.27.
- Page 96 and 97:
Effectiveness of Care Prevention: W
- Page 98 and 99:
Effectiveness of Care Mental Health
- Page 100 and 101:
Effectiveness of Care Figure 2.31.
- Page 102 and 103:
Effectiveness of Care Figure 2.33.
- Page 104 and 105:
Effectiveness of Care NEW Musculosk
- Page 106 and 107:
Effectiveness of Care n In all year
- Page 108 and 109:
Effectiveness of Care NEW Managemen
- Page 110 and 111:
Effectiveness of Care Findings Prev
- Page 112 and 113:
Effectiveness of Care Also, in the
- Page 114 and 115:
Effectiveness of Care Chapter 2 Res
- Page 116 and 117:
Effectiveness of Care Lifestyle Mod
- Page 118 and 119:
Effectiveness of Care n In 5 out of
- Page 120 and 121:
Effectiveness of Care NEW Outcome:
- Page 122 and 123:
Effectiveness of Care Chapter 2 Lif
- Page 124 and 125:
Effectiveness of Care Figure 2.49.
- Page 126 and 127:
Effectiveness of Care Functional St
- Page 128 and 129:
Effectiveness of Care Chapter 2 Fun
- Page 130 and 131:
Effectiveness of Care at admission
- Page 132 and 133:
Effectiveness of Care Supportive an
- Page 134 and 135:
Effectiveness of Care n The 2008 to
- Page 136 and 137:
Effectiveness of Care Chapter 2 Sup
- Page 138 and 139:
Effectiveness of Care Figure 2.58.
- Page 140 and 141:
Effectiveness of Care References 20
- Page 142 and 143:
Effectiveness of Care Centers for M
- Page 144 and 145:
Effectiveness of Care Oral health i
- Page 146 and 147:
140 National Healthcare Disparities
- Page 148 and 149:
Patient Safety To Err Is Human does
- Page 150 and 151:
Patient Safety Figure 3.1. Adult su
- Page 152 and 153:
Patient Safety Also, in the NHQR: n
- Page 154 and 155:
Patient Safety n From 2006-2007 to
- Page 156 and 157:
Patient Safety n From 2004 to 2008,
- Page 158 and 159:
Patient Safety Chapter 3 n From 200
- Page 160 and 161:
154 National Healthcare Disparities
- Page 162 and 163:
Timeliness Findings Getting Care fo
- Page 164 and 165:
Timeliness Chapter 4 n Not all pati
- Page 166 and 167:
Timeliness Chapter 4 n Among heart
- Page 168 and 169:
162 National Healthcare Disparities
- Page 170 and 171:
Patient Centeredness Chapter 5 Simi
- Page 172 and 173:
Patient Centeredness Figure 5.1. Ad
- Page 174 and 175:
Patient Centeredness Figure 5.3. Ch
- Page 176 and 177:
Patient Centeredness Figure 5.5. Ad
- Page 178 and 179:
Patient Centeredness Patient Langua
- Page 180 and 181:
Patient Centeredness Information ab
- Page 182 and 183:
Patient Centeredness Providers Aski
- Page 184 and 185:
178 National Healthcare Quality Rep
- Page 186 and 187:
Care Coordination Importance Chapte
- Page 188 and 189:
Care Coordination n In 2009, Americ
- Page 190 and 191:
Care Coordination Figure 6.3. Paren
- Page 192 and 193:
Care Coordination Also, in the NHQR
- Page 194 and 195:
Care Coordination Chapter 6 n Overa
- Page 196 and 197:
Care Coordination Chapter 6 n Overa
- Page 198 and 199:
Efficiency Findings Chapter 7 Inapp
- Page 200 and 201:
Efficiency Figure 7.2. Potentially
- Page 202 and 203:
Efficiency Comparisons with the 3 S
- Page 204 and 205:
Efficiency Perforated Appendixes Pe
- Page 206 and 207:
Efficiency Figure 7.8. Males age 75
- Page 208 and 209:
202 National Healthcare Disparities
- Page 210 and 211:
Health System Infrastructure Eviden
- Page 212 and 213:
Health System Infrastructure Figure
- Page 214 and 215:
Health System Infrastructure Figure
- Page 216 and 217:
Health System Infrastructure Occupa
- Page 218 and 219:
Health System Infrastructure n From
- Page 220 and 221:
Health System Infrastructure NEW Co
- Page 222 and 223:
Health System Infrastructure Table
- Page 224 and 225:
Health System Infrastructure Refere
- Page 226 and 227:
Access to Health Care Findings Heal
- Page 228 and 229:
Access to Health Care Figure 9.2. P
- Page 230 and 231:
Access to Health Care Figure 9.4. P
- Page 232 and 233:
Access to Health Care Financial Bur
- Page 234 and 235:
Access to Health Care Chapter 9 n O
- Page 236 and 237:
Access to Health Care Figure 9.9. P
- Page 238 and 239:
Priority Populations Chapter 10 232
- Page 240 and 241:
Priority Populations AHRQ’s Prior
- Page 242 and 243:
Priority Populations Blacks or Afri
- Page 244 and 245:
Priority Populations Hispanics or L
- Page 246 and 247:
Priority Populations Geographic are
- Page 248 and 249:
Priority Populations criminal justi
- Page 250 and 251:
Priority Populations Postponement R
- Page 252 and 253:
Priority Populations References Adl
- Page 254 and 255:
248 National Healthcare Disparities
- Page 256:
U.S. Department of Health and Human