Cost benefit analysis of peri-urban land use policy - Plurel
Cost benefit analysis of peri-urban land use policy - Plurel
Cost benefit analysis of peri-urban land use policy - Plurel

Create successful ePaper yourself
Turn your PDF publications into a flip-book with our unique Google optimized e-Paper software.
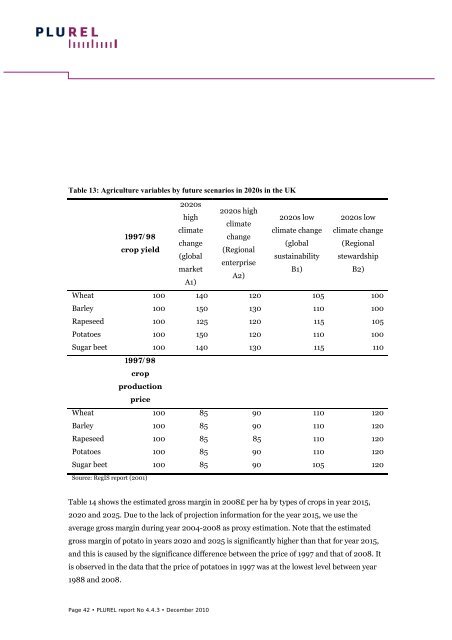
Table 13: Agriculture variables by future scenarios in 2020s in the UK<br />
2020s<br />
2020s high<br />
high<br />
2020s low 2020s low<br />
climate<br />
climate<br />
climate change climate change<br />
1997/98<br />
change<br />
change<br />
(global (Regional<br />
crop yield<br />
(Regional<br />
(global<br />
sustainability stewardship<br />
enterprise<br />
market<br />
B1)<br />
B2)<br />
A2)<br />
A1)<br />
Wheat 100 140 120 105 100<br />
Barley 100 150 130 110 100<br />
Rapeseed 100 125 120 115 105<br />
Potatoes 100 150 120 110 100<br />
Sugar beet 100 140 130 115 110<br />
1997/98<br />
crop<br />
production<br />
price<br />
Wheat 100 85 90 110 120<br />
Barley 100 85 90 110 120<br />
Rapeseed 100 85 85 110 120<br />
Potatoes 100 85 90 110 120<br />
Sugar beet 100 85 90 105 120<br />
Source: RegIS report (2001)<br />
Table 14 shows the estimated gross margin in 2008£ per ha by types <strong>of</strong> crops in year 2015,<br />
2020 and 2025. Due to the lack <strong>of</strong> projection information for the year 2015, we <strong>use</strong> the<br />
average gross margin during year 2004-2008 as proxy estimation. Note that the estimated<br />
gross margin <strong>of</strong> potato in years 2020 and 2025 is significantly higher than that for year 2015,<br />
and this is ca<strong>use</strong>d by the significance difference between the price <strong>of</strong> 1997 and that <strong>of</strong> 2008. It<br />
is observed in the data that the price <strong>of</strong> potatoes in 1997 was at the lowest level between year<br />
1988 and 2008.<br />
Page 42 • PLUREL report No 4.4.3 • December 2010