Wine Investment in South Africa - Cape Wine Academy
Wine Investment in South Africa - Cape Wine Academy
Wine Investment in South Africa - Cape Wine Academy
Create successful ePaper yourself
Turn your PDF publications into a flip-book with our unique Google optimized e-Paper software.
Hence the growth of dozens of <strong>in</strong>vestment firms <strong>in</strong> Europe, the US and <strong>in</strong>creas<strong>in</strong>gly <strong>in</strong> Asia<br />
now offer<strong>in</strong>g clients’ portfolios of w<strong>in</strong>es to buy <strong>in</strong>to, most offer<strong>in</strong>g professional storage<br />
facilities for client’s w<strong>in</strong>es and a brokerage service. Huge storage facilities exist on most<br />
cont<strong>in</strong>ents merely to hold stocks of w<strong>in</strong>e under perfect long term conditions with ownership<br />
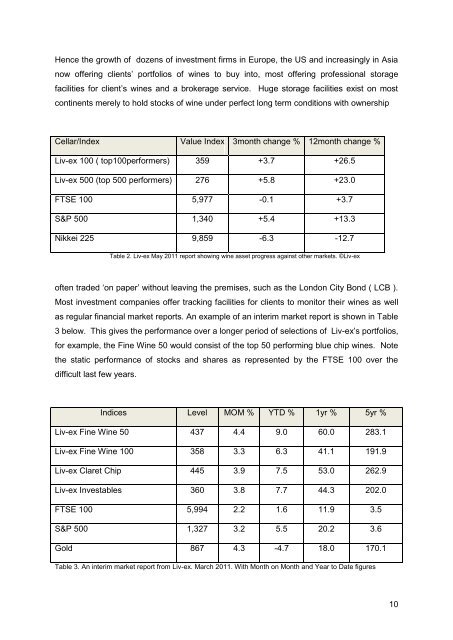
Cellar/Index Value Index 3month change % 12month change %<br />
Liv-ex 100 ( top100performers) 359 +3.7 +26.5<br />
Liv-ex 500 (top 500 performers) 276 +5.8 +23.0<br />
FTSE 100 5,977 -0.1 +3.7<br />
S&P 500 1,340 +5.4 +13.3<br />
Nikkei 225 9,859 -6.3 -12.7<br />
Table 2. Liv-ex May 2011 report show<strong>in</strong>g w<strong>in</strong>e asset progress aga<strong>in</strong>st other markets. ©Liv-ex<br />
often traded ‘on paper’ without leav<strong>in</strong>g the premises, such as the London City Bond ( LCB ).<br />
Most <strong>in</strong>vestment companies offer track<strong>in</strong>g facilities for clients to monitor their w<strong>in</strong>es as well<br />
as regular f<strong>in</strong>ancial market reports. An example of an <strong>in</strong>terim market report is shown <strong>in</strong> Table<br />
3 below. This gives the performance over a longer period of selections of Liv-ex’s portfolios,<br />
for example, the F<strong>in</strong>e <strong>W<strong>in</strong>e</strong> 50 would consist of the top 50 perform<strong>in</strong>g blue chip w<strong>in</strong>es. Note<br />
the static performance of stocks and shares as represented by the FTSE 100 over the<br />
difficult last few years.<br />
Indices Level MOM % YTD % 1yr % 5yr %<br />
Liv-ex F<strong>in</strong>e <strong>W<strong>in</strong>e</strong> 50 437 4.4 9.0 60.0 283.1<br />
Liv-ex F<strong>in</strong>e <strong>W<strong>in</strong>e</strong> 100 358 3.3 6.3 41.1 191.9<br />
Liv-ex Claret Chip 445 3.9 7.5 53.0 262.9<br />
Liv-ex Investables 360 3.8 7.7 44.3 202.0<br />
FTSE 100 5,994 2.2 1.6 11.9 3.5<br />
S&P 500 1,327 3.2 5.5 20.2 3.6<br />
Gold 867 4.3 -4.7 18.0 170.1<br />
Table 3. An <strong>in</strong>terim market report from Liv-ex. March 2011. With Month on Month and Year to Date figures<br />
10


