Wine Investment in South Africa - Cape Wine Academy
Wine Investment in South Africa - Cape Wine Academy
Wine Investment in South Africa - Cape Wine Academy
Create successful ePaper yourself
Turn your PDF publications into a flip-book with our unique Google optimized e-Paper software.
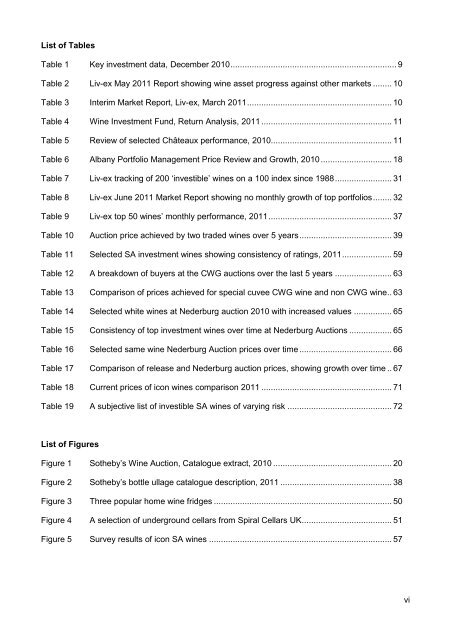
List of Tables<br />
Table 1 Key <strong>in</strong>vestment data, December 2010 ...................................................................... 9<br />
Table 2 Liv-ex May 2011 Report show<strong>in</strong>g w<strong>in</strong>e asset progress aga<strong>in</strong>st other markets ........ 10<br />
Table 3 Interim Market Report, Liv-ex, March 2011 ............................................................. 10<br />
Table 4 <strong>W<strong>in</strong>e</strong> <strong>Investment</strong> Fund, Return Analysis, 2011 ....................................................... 11<br />
Table 5 Review of selected Châteaux performance, 2010................................................... 11<br />
Table 6 Albany Portfolio Management Price Review and Growth, 2010 .............................. 18<br />
Table 7 Liv-ex track<strong>in</strong>g of 200 ‘<strong>in</strong>vestible’ w<strong>in</strong>es on a 100 <strong>in</strong>dex s<strong>in</strong>ce 1988 ........................ 31<br />
Table 8 Liv-ex June 2011 Market Report show<strong>in</strong>g no monthly growth of top portfolios ........ 32<br />
Table 9 Liv-ex top 50 w<strong>in</strong>es’ monthly performance, 2011 .................................................... 37<br />
Table 10 Auction price achieved by two traded w<strong>in</strong>es over 5 years ....................................... 39<br />
Table 11 Selected SA <strong>in</strong>vestment w<strong>in</strong>es show<strong>in</strong>g consistency of rat<strong>in</strong>gs, 2011 ..................... 59<br />
Table 12 A breakdown of buyers at the CWG auctions over the last 5 years ........................ 63<br />
Table 13 Comparison of prices achieved for special cuvee CWG w<strong>in</strong>e and non CWG w<strong>in</strong>e .. 63<br />
Table 14 Selected white w<strong>in</strong>es at Nederburg auction 2010 with <strong>in</strong>creased values ................ 65<br />
Table 15 Consistency of top <strong>in</strong>vestment w<strong>in</strong>es over time at Nederburg Auctions .................. 65<br />
Table 16 Selected same w<strong>in</strong>e Nederburg Auction prices over time ....................................... 66<br />
Table 17 Comparison of release and Nederburg auction prices, show<strong>in</strong>g growth over time .. 67<br />
Table 18 Current prices of icon w<strong>in</strong>es comparison 2011 ....................................................... 71<br />
Table 19 A subjective list of <strong>in</strong>vestible SA w<strong>in</strong>es of vary<strong>in</strong>g risk ............................................ 72<br />
List of Figures<br />
Figure 1 Sotheby’s <strong>W<strong>in</strong>e</strong> Auction, Catalogue extract, 2010 .................................................. 20<br />
Figure 2 Sotheby’s bottle ullage catalogue description, 2011 ............................................... 38<br />
Figure 3 Three popular home w<strong>in</strong>e fridges ........................................................................... 50<br />
Figure 4 A selection of underground cellars from Spiral Cellars UK ...................................... 51<br />
Figure 5 Survey results of icon SA w<strong>in</strong>es ............................................................................. 57<br />
vi


