Wine Investment in South Africa - Cape Wine Academy
Wine Investment in South Africa - Cape Wine Academy
Wine Investment in South Africa - Cape Wine Academy

Create successful ePaper yourself
Turn your PDF publications into a flip-book with our unique Google optimized e-Paper software.
For the top châteaux, returns have averaged 18%, which would see the <strong>in</strong>vestor pay<br />
some R42,750 <strong>in</strong> fees and realise a net profit of 81% or 16.2% a year.<br />
These are solid returns but note that costs paid by the <strong>in</strong>vestor over 5 years vary<br />
between 22% and 39% of the <strong>in</strong>itial <strong>in</strong>vestment and some charges eg management fees,<br />
would still be due if the portfolio was not achiev<strong>in</strong>g such positive returns.<br />
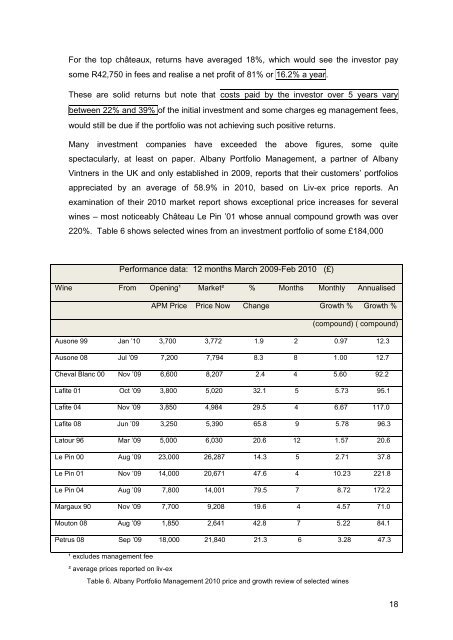
Many <strong>in</strong>vestment companies have exceeded the above figures, some quite<br />
spectacularly, at least on paper. Albany Portfolio Management, a partner of Albany<br />
V<strong>in</strong>tners <strong>in</strong> the UK and only established <strong>in</strong> 2009, reports that their customers’ portfolios<br />
appreciated by an average of 58.9% <strong>in</strong> 2010, based on Liv-ex price reports. An<br />
exam<strong>in</strong>ation of their 2010 market report shows exceptional price <strong>in</strong>creases for several<br />
w<strong>in</strong>es – most noticeably Château Le P<strong>in</strong> ’01 whose annual compound growth was over<br />
220%. Table 6 shows selected w<strong>in</strong>es from an <strong>in</strong>vestment portfolio of some £184,000<br />
Performance data: 12 months March 2009-Feb 2010 (£)<br />
<strong>W<strong>in</strong>e</strong> From Open<strong>in</strong>g¹ Market² % Months Monthly Annualised<br />
APM Price Price Now Change Growth % Growth %<br />
(compound) ( compound)<br />
Ausone 99 Jan ’10 3,700 3,772 1.9 2 0.97 12.3<br />
Ausone 08 Jul ’09 7,200 7,794 8.3 8 1.00 12.7<br />
Cheval Blanc 00 Nov ’09 6,600 8,207 2.4 4 5.60 92.2<br />
Lafite 01 Oct ’09 3,800 5,020 32.1 5 5.73 95.1<br />
Lafite 04 Nov ’09 3,850 4,984 29.5 4 6.67 117.0<br />
Lafite 08 Jun ’09 3,250 5,390 65.8 9 5.78 96.3<br />
Latour 96 Mar ’09 5,000 6,030 20.6 12 1.57 20.6<br />
Le P<strong>in</strong> 00 Aug ’09 23,000 26,287 14.3 5 2.71 37.8<br />
Le P<strong>in</strong> 01 Nov ’09 14,000 20,671 47.6 4 10.23 221.8<br />
Le P<strong>in</strong> 04 Aug ’09 7,800 14,001 79.5 7 8.72 172.2<br />
Margaux 90 Nov ’09 7,700 9,208 19.6 4 4.57 71.0<br />
Mouton 08 Aug ’09 1,850 2,641 42.8 7 5.22 84.1<br />
Petrus 08 Sep ’09 18,000 21,840 21.3 6 3.28 47.3<br />
¹ excludes management fee<br />
² average prices reported on liv-ex<br />
Table 6. Albany Portfolio Management 2010 price and growth review of selected w<strong>in</strong>es<br />
18