ANNUAL REPORT 2005 - Lukoil
ANNUAL REPORT 2005 - Lukoil
ANNUAL REPORT 2005 - Lukoil

Create successful ePaper yourself
Turn your PDF publications into a flip-book with our unique Google optimized e-Paper software.
FINANCIAL ACCOUNTS<br />
MANAGEMENT'S DISCUSSION AND ANALYSIS OF FINANCIAL<br />
CONDITION AND RESULTS OF OPERATIONS<br />
The following represents management's analysis of the financial performance and conditions of OAO LUKOIL and significant<br />
trends that may affect its future performance. It should be read in conjunction with our US GAAP consolidated<br />
financial statements and notes and supplemental oil and gas disclosure.<br />
References to "LUKOIL", "the Company", "the Group", "we" or "us" are references to OAO LUKOIL and its subsidiaries and<br />
associates. All dollar amounts are in millions of US dollars, unless otherwise indicated. Tonnes of crude oil produced are<br />
translated into barrels using conversion rates characterizing the density of oil from each of our oilfields. Tonnes of crude oil<br />
purchased as well as other operational indicators expressed in barrels are translated into barrels using an average conversion<br />
rate of 7.33. Billions of cubic feet are translated into millions of oil equivalent barrels using a conversion rate of 0.167.<br />
This report includes forward-looking statements – words such as "believes", "anticipates", "expects", "estimates",<br />
"intends", "plans", etc. – that reflect management's current estimates and beliefs, but are not guarantees of future results.<br />
Please see "Forward-looking statement" on page 179 for a discussion of some of the factors that could cause actual<br />
results to differ materially.<br />
KEY FINANCIAL AND OPERATIONAL RESULTS<br />
<strong>2005</strong><br />
Change<br />
from 2004<br />
2004<br />
Change<br />
from 2003<br />
2003<br />
Sales (including excise and export tariffs) 55,774 64.8% 33,845 53.0% 22,118<br />
Net Income 6,443 51.7% 4,248 14.8% 3,701<br />
Net income excluding cumulative effect<br />
of change in accounting principle and gain<br />
from sale of share in Azeri, Chirag,<br />
Guneshli in 2003 6,443 51.7% 4,248 78.0% 2,386<br />
EBITDA 10,404 44.4% 7,203 27.9% 5,630<br />
Earnings per share of common stock<br />
(US dollars)<br />
Basic earnings 7.91 52.1% 5.20 15.0% 4.52<br />
Diluted earnings 7.79 51.9% 5.13 15.3% 4.45<br />
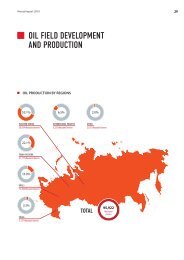
Crude oil production by consolidated subsidiaries<br />
(thousands of tonnes) 86,193 4.6% 82,408 8.3% 76,072<br />
Crude oil production by the Group<br />
including our share in equity associates<br />
(thousands of tonnes) 90,158 4.6% 86,200 7.4% 80,226<br />
Refined products produced by consolidated<br />
subsidiaries (thousands of tonnes) 44,182 8.2% 40,825 4.1% 39,233<br />
During <strong>2005</strong> net income was $6,443 million, which is $2,195 million more than in the 2004.<br />
The increase in net income resulted from favorable price conditions in <strong>2005</strong> and effective cost control. However,<br />
an increased tax burden has restrained growth of our profitability. This restraining factor as well as other drivers impacting<br />
the results of our operations are considered below in detail.<br />
100