

2011 Index of Silicon Valley - Silicon Valley Community Foundation
2011 Index of Silicon Valley - Silicon Valley Community Foundation
2011 Index of Silicon Valley - Silicon Valley Community Foundation

Create successful ePaper yourself
Turn your PDF publications into a flip-book with our unique Google optimized e-Paper software.
MY<br />
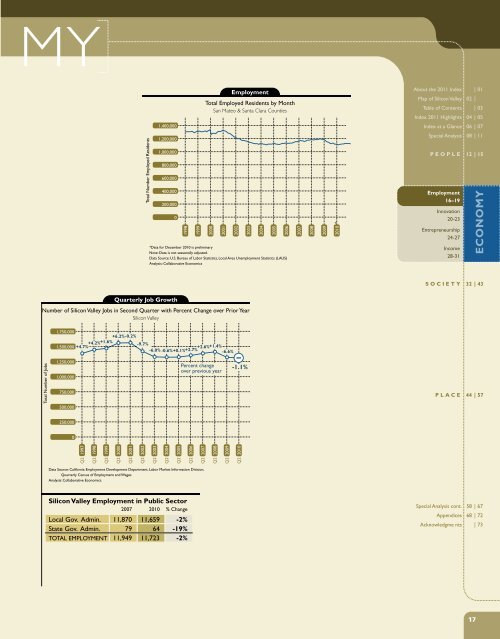
Employment<br />
Total Employed Residents by Month<br />
San Mateo & Santa Clara Counties<br />
About the <strong>2011</strong> <strong>Index</strong> | 01<br />
Map <strong>of</strong> <strong>Silicon</strong> <strong>Valley</strong> 02 |<br />
Table <strong>of</strong> Contents | 03<br />
<strong>Index</strong> <strong>2011</strong> Highlights 04 | 05<br />
1,400,000<br />
<strong>Index</strong> at a Glance 06 | 07<br />
Total Number Employed Residents<br />
1,200,000<br />
1,000,000<br />
800,000<br />
600,000<br />
400,000<br />
200,000<br />
0<br />
1998<br />
1999<br />
2000<br />
*Data for December 2010 is preliminary<br />
Note: Data is not seasonally adjusted.<br />
Data Source: U.S. Bureau <strong>of</strong> Labor Statistics, Local Area Unemployment Statistics (LAUS)<br />
Analysis: Collaborative Economics<br />
2001<br />
2002<br />
2003<br />
2004<br />
2005<br />
Special Analysis 08 | 11<br />
PEOPLE 12 | 15<br />
Employment<br />
16–19<br />
Innovation<br />
20-23<br />
Entrepreneurship<br />
24-27<br />
Income<br />
28-31<br />
ECONOMY<br />
SOCIETY 32 | 43<br />
Number <strong>of</strong> <strong>Silicon</strong> <strong>Valley</strong> Jobs in Second Quarter with Percent Change over Prior Year<br />
<strong>Silicon</strong> <strong>Valley</strong><br />
1,750,000<br />
+6.2%-0.2%<br />
1,500,000 +4.7% +4.2%+1.6% -9.7%<br />
-6.0% -0.6%+0.1% +2.7% +2.6% +1.4%<br />
-6.6%<br />
1,250,000<br />
1,000,000<br />
750,000<br />
500,000<br />
PLACE 44 | 57<br />
250,000<br />
0<br />
1997<br />
1998<br />
2006<br />
1999<br />
2007<br />
2000<br />
2001<br />
2008<br />
2002<br />
2009<br />
2003<br />
*<br />
2004<br />
2010<br />
2005<br />
2006<br />
2007<br />
2008<br />
2010<br />
Total Number <strong>of</strong> Jobs<br />
Quarterly Job Growth<br />
Percent change<br />
over previous year<br />
-1.1%<br />
Q2<br />
Q2<br />
Q2<br />
Q2<br />
Q2<br />
Q2<br />
Q2<br />
Q2<br />
Q2<br />
Q2<br />
Q2<br />
2009<br />
Q2<br />
Q2<br />
Q2<br />
Data Source: California Employment Development Department, Labor Market Information Division,<br />
Quarterly Census <strong>of</strong> Employment and Wages<br />
Analysis: Collaborative Economics<br />
<strong>Silicon</strong> <strong>Valley</strong> Employment in Public Sector<br />
2007 2010 % Change<br />
Local Gov. Admin. 11,870 11,659 -2%<br />
State Gov. Admin. 79 64 -19%<br />
TOTAL EMPLOYMENT 11,949 11,723 -2%<br />
Special Analysis cont. 58 | 67<br />
Appendices 68 | 72<br />
Acknowledgme nts | 73<br />
17


