

2011 Index of Silicon Valley - Silicon Valley Community Foundation
2011 Index of Silicon Valley - Silicon Valley Community Foundation
2011 Index of Silicon Valley - Silicon Valley Community Foundation

Create successful ePaper yourself
Turn your PDF publications into a flip-book with our unique Google optimized e-Paper software.
Special Analysis<br />
The Crisis in Local Government and Choices Facing Our Communities<br />
Understanding the Challenge<br />
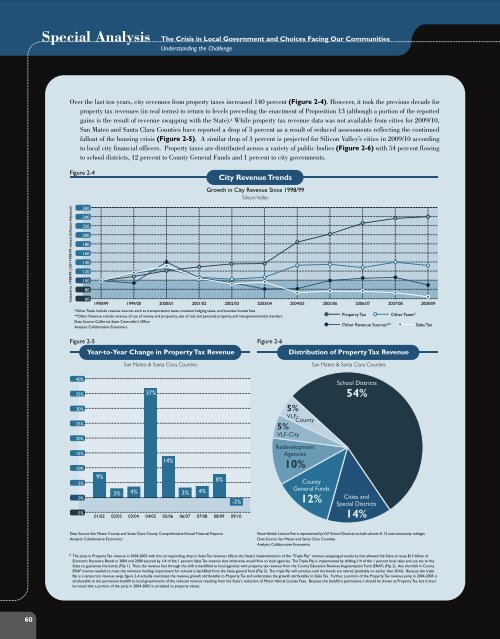
Over the last ten years, city revenues from property taxes increased 140 percent (Figure 2-4). However, it took the previous decade for<br />
property tax revenues (in real terms) to return to levels preceding the enactment <strong>of</strong> Proposition 13 (although a portion <strong>of</strong> the reported<br />
gains is the result <strong>of</strong> revenue swapping with the State). 6 While property tax revenue data was not available from cities for 2009/10,<br />
San Mateo and Santa Clara Counties have reported a drop <strong>of</strong> 3 percent as a result <strong>of</strong> reduced assessments reflecting the continued<br />
fallout <strong>of</strong> the housing crisis (Figure 2-5). A similar drop <strong>of</strong> 3 percent is projected for <strong>Silicon</strong> <strong>Valley</strong>’s cities in 2009/10 according<br />
to local city financial <strong>of</strong>ficers. Property taxes are distributed across a variety <strong>of</strong> public bodies (Figure 2-6) with 54 percent flowing<br />
to school districts, 12 percent to County General Funds and 1 percent to city governments.<br />
Figure 2-4<br />
City Revenue Trends<br />
Growth in City Revenue Since 1998/99<br />
<strong>Silicon</strong> <strong>Valley</strong><br />
<strong>Index</strong>ed to 1998/99 (100=1998/99 values) (Inflation Adjusted)<br />
260<br />
240<br />
220<br />
200<br />
180<br />
160<br />
140<br />
120<br />
100<br />
80<br />
60<br />
1998/99 1999/00 2000/01 2001/02 2002/03 2003/04 2004/05 2005/06 2006/07 2007/08 2008/09<br />
*Other Taxes include revenue sources such as transportation taxes, transient lodging taxes, and business license fees<br />
**Other Revenue include revenue <strong>of</strong> use <strong>of</strong> money and propoerty, sale <strong>of</strong> real and personal property, and intergovernmental transfers<br />
Data Source: California State Controller’s Office<br />
Analysis: Collaborative Economics<br />
Property Tax<br />
Other Revenue Sources**<br />
Other Taxes*<br />
Sales Tax<br />
Figure 2-5 Figure 2-6<br />
Year-to-Year Change in Property Tax Revenue<br />
San Mateo & Santa Clara Counties<br />
Distribution <strong>of</strong> Property Tax Revenue<br />
San Mateo & Santa Clara Counties<br />
40%<br />
35%<br />
30%<br />
25%<br />
20%<br />
15%<br />
10%<br />
5%<br />
0%<br />
-5%<br />
9%<br />
3% 4%<br />
37%<br />
14%<br />
3% 4%<br />
01/02 02/03 03/04 04/05 05/06 06/07 07/08 08/09 09/10<br />
8%<br />
-3%<br />
5%<br />
VLF- County<br />
5%<br />
VLF-City<br />
Redevelopment<br />
Agencies<br />
10%<br />
County<br />
General Funds<br />
12%<br />
School Districts<br />
54%<br />
Cities and<br />
Special Districts<br />
14%<br />
Data Source: San Mateo County and Santa Clara County Comprehensive Annual Financial Reports<br />
Analysis: Collaborative Economics<br />
Note: Vehicle Licence Fee is represented by VLF School Districts include schools K-12 and community colleges<br />
Data Source: San Mateo and Santa Clara Counties<br />
Analysis: Collaborative Economics<br />
6 The jump in Property Tax revenue in 2004-2005 with the corresponding drop in Sales Tax revenue reflects the State’s implementation <strong>of</strong> the “Triple-Flip” revenue swapping procedures that allowed the State to issue $15 billion <strong>of</strong><br />
Economic Recovery Bonds in 2004 and 2008 secured by 1/4 <strong>of</strong> the 1 percent Sales Tax revenue that otherwise would flow to local agencies. The Triple-Flip is implemented by shifting 1/4 <strong>of</strong> the 1 percent local sales and use tax to the<br />
State to guarantee the bonds (Flip 1). Then, the revenue lost through the shift is backfilled to local agencies with property tax revenue from the County Education Revenue Augmentation Fund (ERAF) (Flip 2). Any shortfall in County<br />
ERAF monies needed to meet the minimum funding requirement for schools is backfilled from the State general fund (Flip 3). The triple flip will continue until the bonds are retired (probably no earlier than 2016). Because the triple<br />
flip is a temporary revenue swap, figure 2-4 actually overstates the revenue growth attributable to Property Tax and understates the growth attributable to Sales Tax. Further, a portion <strong>of</strong> the Property Tax revenue jump in 2004-2005 is<br />
attributable to the permanent backfill to local governments <strong>of</strong> the reduced revenue resulting from the State’s reduction <strong>of</strong> Motor Vehicle License Fees. Because this backfill is permanent, it should be shown as Property Tax, but it must<br />
be noted that a portion <strong>of</strong> the jump in 2004-2005 is unrelated to property values.<br />
60


