

2011 Index of Silicon Valley - Silicon Valley Community Foundation
2011 Index of Silicon Valley - Silicon Valley Community Foundation
2011 Index of Silicon Valley - Silicon Valley Community Foundation

Create successful ePaper yourself
Turn your PDF publications into a flip-book with our unique Google optimized e-Paper software.
Preparing for Economic Success<br />
The region’s youth are making progress<br />
on multiple measures <strong>of</strong> achievement,<br />
but gaining access to higher education<br />
is becoming more challenging.<br />
WHY IS THIS IMPORTANT<br />
The future success <strong>of</strong> the region’s young people in a knowledge-based<br />
economy will be determined largely by how well elementary and<br />
secondary education in <strong>Silicon</strong> <strong>Valley</strong> prepares its students for<br />
higher levels <strong>of</strong> education.<br />
How well the region is preparing its youth for postsecondary education<br />
can be observed in graduation rates and the percentage <strong>of</strong><br />
graduates completing courses required for entrance to the<br />
University <strong>of</strong> California (UC) or California State University (CSU).<br />
Likewise, high school dropouts are significantly more likely to be<br />
unemployed and earn less when they are employed than high<br />
school graduates. Indicators in gateway skills such as algebra<br />
pr<strong>of</strong>iciency are highly correlated with later academic success. As<br />
tuition rises in both the CSU and UC systems statewide, paying<br />
for college becomes a growing barrier to obtaining a universitylevel<br />
education.<br />
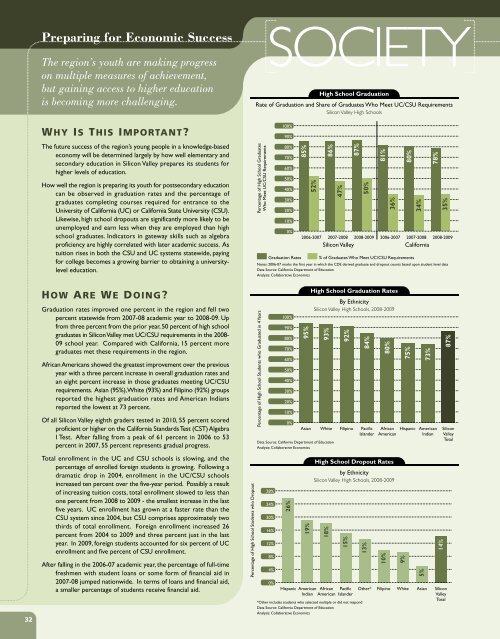
Rate <strong>of</strong> Graduation and Share <strong>of</strong> Graduates Who Meet UC/CSU Requirements<br />
<strong>Silicon</strong> <strong>Valley</strong> High Schools<br />
Percentage <strong>of</strong> High School Graduates<br />
Who Meet UC/CSU Requirements<br />
SOCIETY<br />
100%<br />
90%<br />
80%<br />
70%<br />
60%<br />
50%<br />
40%<br />
30%<br />
20%<br />
10%<br />
0%<br />
Graduation Rates<br />
85%<br />
52%<br />
High School Graduation<br />
86%<br />
47%<br />
87%<br />
50%<br />
81%<br />
36%<br />
80%<br />
2006-2007 2007-2008 2008-2009 2006-2007 2007-2008 2008-2009<br />
<strong>Silicon</strong> <strong>Valley</strong><br />
California<br />
% <strong>of</strong> Graduates Who Meet UC/CSU Requirements<br />
34%<br />
78%<br />
Notes: 2006-07 marks the first year in which the CDE derived graduate and dropout counts based upon student level data<br />
Data Source: California Department <strong>of</strong> Education<br />
Analysis: Collaborative Economics<br />
35%<br />
32<br />
HOW ARE WE DOING<br />
Graduation rates improved one percent in the region and fell two<br />
percent statewide from 2007-08 academic year to 2008-09. Up<br />
from three percent from the prior year, 50 percent <strong>of</strong> high school<br />
graduates in <strong>Silicon</strong> <strong>Valley</strong> met UC/CSU requirements in the 2008-<br />
09 school year. Compared with California, 15 percent more<br />
graduates met these requirements in the region.<br />
African Americans showed the greatest improvement over the previous<br />
year with a three percent increase in overall graduation rates and<br />
an eight percent increase in those graduates meeting UC/CSU<br />
requirements. Asian (95%), White (93%) and Filipino (92%) groups<br />
reported the highest graduation rates and American Indians<br />
reported the lowest at 73 percent.<br />
Of all <strong>Silicon</strong> <strong>Valley</strong> eighth graders tested in 2010, 55 percent scored<br />
pr<strong>of</strong>icient or higher on the California Standards Test (CST) Algebra<br />
I Test. After falling from a peak <strong>of</strong> 61 percent in 2006 to 53<br />
percent in 2007, 55 percent represents gradual progress.<br />
Total enrollment in the UC and CSU schools is slowing, and the<br />
percentage <strong>of</strong> enrolled foreign students is growing. Following a<br />
dramatic drop in 2004, enrollment in the UC/CSU schools<br />
increased ten percent over the five-year period. Possibly a result<br />
<strong>of</strong> increasing tuition costs, total enrollment slowed to less than<br />
one percent from 2008 to 2009 - the smallest increase in the last<br />
five years. UC enrollment has grown at a faster rate than the<br />
CSU system since 2004, but CSU comprises approximately two<br />
thirds <strong>of</strong> total enrollment. Foreign enrollment increased 26<br />
percent from 2004 to 2009 and three percent just in the last<br />
year. In 2009, foreign students accounted for six percent <strong>of</strong> UC<br />
enrollment and five percent <strong>of</strong> CSU enrollment.<br />
After falling in the 2006-07 academic year, the percentage <strong>of</strong> full-time<br />
freshmen with student loans or some form <strong>of</strong> financial aid in<br />
2007-08 jumped nationwide. In terms <strong>of</strong> loans and financial aid,<br />
a smaller percentage <strong>of</strong> students receive financial aid.<br />
Percentage <strong>of</strong> High School Students who Dropout<br />
Percentage <strong>of</strong> High School Students who Graduated in 4 Years<br />
28%<br />
24%<br />
20%<br />
16%<br />
12%<br />
8%<br />
4%<br />
100%<br />
90%<br />
80%<br />
70%<br />
60%<br />
50%<br />
40%<br />
30%<br />
20%<br />
10%<br />
0%<br />
26%<br />
95%<br />
Hispanic American<br />
Indian<br />
High School Graduation Rates<br />
By Ethnicity<br />
<strong>Silicon</strong> <strong>Valley</strong> High Schools, 2008-2009<br />
93%<br />
Data Source: California Department <strong>of</strong> Education<br />
Analysis: Collaborative Economics<br />
0%<br />
Asian White Filipino Pacific<br />
Islander<br />
19%<br />
by Ethnicity<br />
<strong>Silicon</strong> <strong>Valley</strong> High Schools, 2008-2009<br />
African<br />
American<br />
92%<br />
Pacific<br />
Islander<br />
84%<br />
80%<br />
High School Dropout Rates<br />
18%<br />
15%<br />
*Other includes students who selected multiple or did not respond<br />
Data Source: California Department <strong>of</strong> Education<br />
Analysis: Collaborative Economics<br />
13%<br />
75%<br />
73%<br />
African Hispanic American<br />
American<br />
Indian<br />
10%<br />
9%<br />
5%<br />
14%<br />
87%<br />
<strong>Silicon</strong><br />
<strong>Valley</strong><br />
Total<br />
Other* Filipino White Asian <strong>Silicon</strong><br />
<strong>Valley</strong><br />
Total


