

2011 Index of Silicon Valley - Silicon Valley Community Foundation
2011 Index of Silicon Valley - Silicon Valley Community Foundation
2011 Index of Silicon Valley - Silicon Valley Community Foundation

You also want an ePaper? Increase the reach of your titles
YUMPU automatically turns print PDFs into web optimized ePapers that Google loves.
Transportation<br />
PLACE<br />
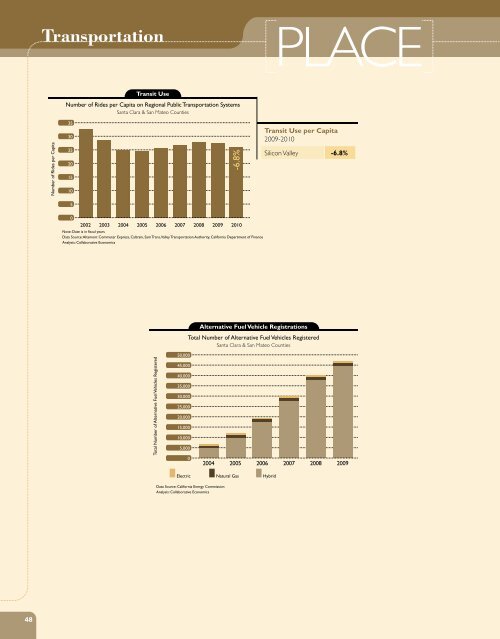
Transit Use<br />
Number <strong>of</strong> Rides per Capita on Regional Public Transportation Systems<br />
Santa Clara & San Mateo Counties<br />
35<br />
30<br />
Transit Use per Capita<br />
2009-2010<br />
Number <strong>of</strong> Rides per Capita<br />
25<br />
20<br />
15<br />
10<br />
-6.8%<br />
<strong>Silicon</strong> <strong>Valley</strong> -6.8%<br />
5<br />
0<br />
2002 2003 2004 2005 2006 2007 2008 2009 2010<br />
Note: Date is in fiscal years<br />
Data Source: Altamont Commuter Express, Caltrain, Sam Trans, <strong>Valley</strong> Transportation Authority, California Department <strong>of</strong> Finance<br />
Analysis: Collaborative Economics<br />
Alternative Fuel Vehicle Registrations<br />
Total Number <strong>of</strong> Alternative Fuel Vehicles Registered<br />
Santa Clara & San Mateo Counties<br />
50,000<br />
Total Number <strong>of</strong> Alternative Fuel Vehicles Registered<br />
45,000<br />
40,000<br />
35,000<br />
30,000<br />
25,000<br />
20,000<br />
15,000<br />
10,000<br />
5,000<br />
0<br />
2004<br />
2005 2006 2007 2008 2009<br />
Electric<br />
Natural Gas<br />
Hybrid<br />
Data Source: California Energy Commission<br />
Analysis: Collaborative Economics<br />
48


