

2011 Index of Silicon Valley - Silicon Valley Community Foundation
2011 Index of Silicon Valley - Silicon Valley Community Foundation
2011 Index of Silicon Valley - Silicon Valley Community Foundation

Create successful ePaper yourself
Turn your PDF publications into a flip-book with our unique Google optimized e-Paper software.
Land Use<br />
Progress toward denser, transit-oriented<br />
development is receding.<br />
PLACE<br />
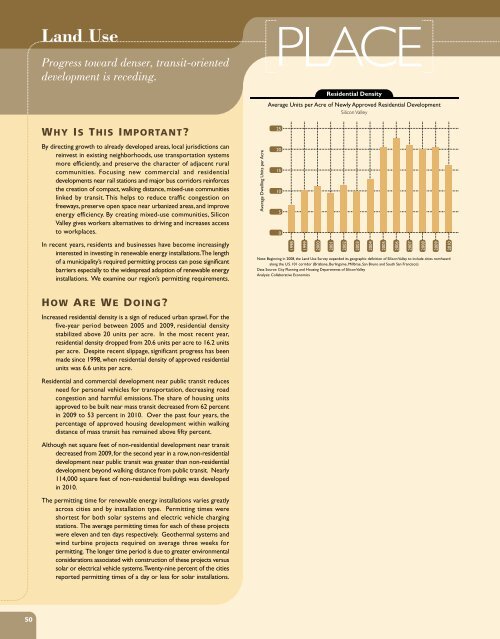
Residential Density<br />
Average Units per Acre <strong>of</strong> Newly Approved Residential Development<br />
<strong>Silicon</strong> <strong>Valley</strong><br />
WHY IS THIS IMPORTANT<br />
By directing growth to already developed areas, local jurisdictions can<br />
reinvest in existing neighborhoods, use transportation systems<br />
more efficiently, and preserve the character <strong>of</strong> adjacent rural<br />
communities. Focusing new commercial and residential<br />
developments near rail stations and major bus corridors reinforces<br />
the creation <strong>of</strong> compact, walking distance, mixed-use communities<br />
linked by transit. This helps to reduce traffic congestion on<br />
freeways, preserve open space near urbanized areas, and improve<br />
energy efficiency. By creating mixed-use communities, <strong>Silicon</strong><br />
<strong>Valley</strong> gives workers alternatives to driving and increases access<br />
to workplaces.<br />
In recent years, residents and businesses have become increasingly<br />
interested in investing in renewable energy installations. The length<br />
<strong>of</strong> a municipality’s required permitting process can pose significant<br />
barriers especially to the widespread adoption <strong>of</strong> renewable energy<br />
installations. We examine our region’s permitting requirements.<br />
Average Dwelling Units per Acre<br />
25<br />
20<br />
15<br />
10<br />
5<br />
0<br />
1998<br />
1999<br />
2000<br />
2001<br />
2002<br />
Note: Beginning in 2008, the Land Use Survey expanded its geographic definition <strong>of</strong> <strong>Silicon</strong> <strong>Valley</strong> to include cities northward<br />
along the U.S. 101 corridor (Brisbane, Burlingame, Millbrae, San Bruno and South San Francisco)<br />
Data Source: City Planning and Housing Departments <strong>of</strong> <strong>Silicon</strong> <strong>Valley</strong><br />
Analysis: Collaborative Economics<br />
2003<br />
2004<br />
2005<br />
2006<br />
2007<br />
2008<br />
2009<br />
2010<br />
HOW ARE WE DOING<br />
Increased residential density is a sign <strong>of</strong> reduced urban sprawl. For the<br />
five-year period between 2005 and 2009, residential density<br />
stabilized above 20 units per acre. In the most recent year,<br />
residential density dropped from 20.6 units per acre to 16.2 units<br />
per acre. Despite recent slippage, significant progress has been<br />
made since 1998, when residential density <strong>of</strong> approved residential<br />
units was 6.6 units per acre.<br />
Residential and commercial development near public transit reduces<br />
need for personal vehicles for transportation, decreasing road<br />
congestion and harmful emissions. The share <strong>of</strong> housing units<br />
approved to be built near mass transit decreased from 62 percent<br />
in 2009 to 53 percent in 2010. Over the past four years, the<br />
percentage <strong>of</strong> approved housing development within walking<br />
distance <strong>of</strong> mass transit has remained above fifty percent.<br />
Although net square feet <strong>of</strong> non-residential development near transit<br />
decreased from 2009, for the second year in a row, non-residential<br />
development near public transit was greater than non-residential<br />
development beyond walking distance from public transit. Nearly<br />
114,000 square feet <strong>of</strong> non-residential buildings was developed<br />
in 2010.<br />
The permitting time for renewable energy installations varies greatly<br />
across cities and by installation type. Permitting times were<br />
shortest for both solar systems and electric vehicle charging<br />
stations. The average permitting times for each <strong>of</strong> these projects<br />
were eleven and ten days respectively. Geothermal systems and<br />
wind turbine projects required on average three weeks for<br />
permitting. The longer time period is due to greater environmental<br />
considerations associated with construction <strong>of</strong> these projects versus<br />
solar or electrical vehicle systems. Twenty-nine percent <strong>of</strong> the cities<br />
reported permitting times <strong>of</strong> a day or less for solar installations.<br />
50


