

2011 Index of Silicon Valley - Silicon Valley Community Foundation
2011 Index of Silicon Valley - Silicon Valley Community Foundation
2011 Index of Silicon Valley - Silicon Valley Community Foundation

You also want an ePaper? Increase the reach of your titles
YUMPU automatically turns print PDFs into web optimized ePapers that Google loves.
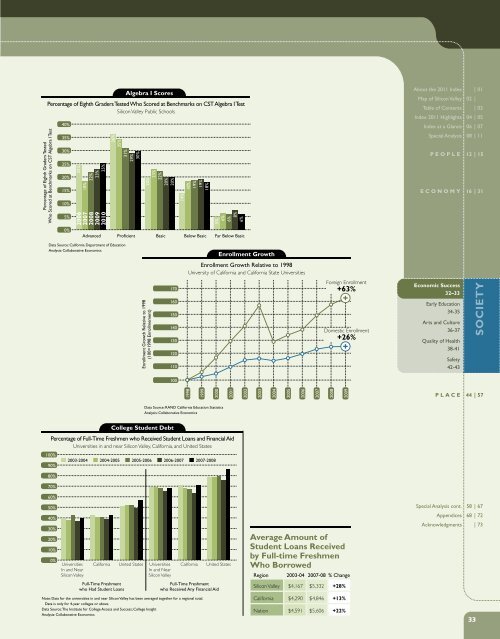
Percentage <strong>of</strong> Eighth Graders Tested<br />
Who Scored at Benchmarks on CST Algebra I Test<br />
Percentage <strong>of</strong> Eighth Graders Tested Who Scored at Benchmarks on CST Algebra I Test<br />
<strong>Silicon</strong> <strong>Valley</strong> Public Schools<br />
40%<br />
35%<br />
30%<br />
25%<br />
20%<br />
15%<br />
10%<br />
5%<br />
0%<br />
25%<br />
18%<br />
22%<br />
23%<br />
25%<br />
2006<br />
2007<br />
2008<br />
2009<br />
2010<br />
36%<br />
35%<br />
Algebra I Scores<br />
31%<br />
29%<br />
30%<br />
20%<br />
23%<br />
22%<br />
20%<br />
20%<br />
Advanced Pr<strong>of</strong>icient Basic Below Basic Far Below Basic<br />
14%<br />
18%<br />
19%<br />
19%<br />
18%<br />
5%<br />
6%<br />
6%<br />
8%<br />
6%<br />
About the <strong>2011</strong> <strong>Index</strong> | 01<br />
Map <strong>of</strong> <strong>Silicon</strong> <strong>Valley</strong> 02 |<br />
Table <strong>of</strong> Contents | 03<br />
<strong>Index</strong> <strong>2011</strong> Highlights 04 | 05<br />
<strong>Index</strong> at a Glance 06 | 07<br />
Special Analysis 08 | 11<br />
PEOPLE 12 | 15<br />
ECONOMY 16 | 31<br />
Data Source: California Department <strong>of</strong> Education<br />
Analysis: Collaborative Economics<br />
Enrollment Growth<br />
Enrollment Growth Relative to 1998<br />
University <strong>of</strong> California and California State Universities<br />
Enrollment Growth Relative to 1998<br />
(100=1998 Enrollmement)<br />
170<br />
160<br />
150<br />
140<br />
130<br />
120<br />
110<br />
Foreign Enrollment<br />
+63%<br />
Domestic Enrollment<br />
+26%<br />
Economic Success<br />
32–33<br />
Early Education<br />
34-35<br />
Arts and Culture<br />
36-37<br />
Quality <strong>of</strong> Health<br />
38-41<br />
Safety<br />
42-43<br />
SOCIETY<br />
100<br />
1998<br />
1999<br />
2000<br />
2001<br />
2002<br />
2003<br />
2004<br />
2005<br />
2006<br />
2007<br />
2008<br />
2009<br />
PLACE 44 | 57<br />
Data Source: RAND California Education Statistics<br />
Analysis: Collaborative Economics<br />
Percentage <strong>of</strong> Full-Time Freshmen who Received Student Loans and Financial Aid<br />
Universities in and near <strong>Silicon</strong> <strong>Valley</strong>, California, and United States<br />
100%<br />
90%<br />
80%<br />
70%<br />
60%<br />
50%<br />
40%<br />
30%<br />
20%<br />
10%<br />
0%<br />
2003-2004 2004-2005 2005-2006 2006-2007 2007-2008<br />
Universities<br />
In and Near<br />
<strong>Silicon</strong> <strong>Valley</strong><br />
California United States Universities<br />
In and Near<br />
<strong>Silicon</strong> <strong>Valley</strong><br />
Full-Time Freshment<br />
who Had Student Loans<br />
College Student Debt<br />
California<br />
Full-Time Freshment<br />
who Received Any Financial Aid<br />
Note: Data for the universities in and near <strong>Silicon</strong> <strong>Valley</strong> has been averaged together for a regional total.<br />
Data is only for 4-year colleges or above.<br />
Data Source: The Institute for College Access and Success; College Insight<br />
Analysis: Collaborative Economics<br />
United States<br />
Average Amount <strong>of</strong><br />
Student Loans Received<br />
by Full-time Freshmen<br />
Who Borrowed<br />
Region<br />
2003-04 2007-08 % Change<br />
<strong>Silicon</strong> <strong>Valley</strong> $4,167 $5,332 +28%<br />
California $4,290 $4,846 +13%<br />
Nation $4,591 $5,606 +22%<br />
Special Analysis cont. 58 | 67<br />
Appendices 68 | 72<br />
Acknowledgments | 73<br />
33


