

2011 Index of Silicon Valley - Silicon Valley Community Foundation
2011 Index of Silicon Valley - Silicon Valley Community Foundation
2011 Index of Silicon Valley - Silicon Valley Community Foundation

Create successful ePaper yourself
Turn your PDF publications into a flip-book with our unique Google optimized e-Paper software.
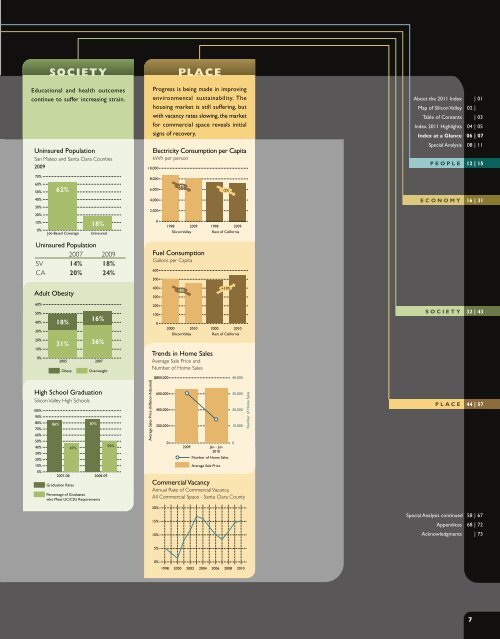
SOCIETY<br />
Educational and health outcomes<br />
continue to suffer increasing strain.<br />
Uninsured Population<br />
San Mateo and Santa Clara Counties<br />
2009<br />
10,000<br />
PLACE<br />
Progress is being made in improving<br />
environmental sustainability. The<br />
housing market is still suffering, but<br />
with vacancy rates slowing, the market<br />
for commercial space reveals initial<br />
signs <strong>of</strong> recovery.<br />
Electricity Consumption per Capita<br />
kWh per person<br />
About the <strong>2011</strong> <strong>Index</strong> | 01<br />
Map <strong>of</strong> <strong>Silicon</strong> <strong>Valley</strong> 02 |<br />
Table <strong>of</strong> Contents | 03<br />
<strong>Index</strong> <strong>2011</strong> Highlights 04 | 05<br />
<strong>Index</strong> at a Glance 06 | 07<br />
Special Analysis 08 | 11<br />
PEOPLE 12 | 15<br />
70%<br />
60%<br />
50%<br />
62%<br />
8,000<br />
6,000<br />
-7%<br />
-2%<br />
40%<br />
30%<br />
20%<br />
10%<br />
0%<br />
Job-Based Coverage<br />
18%<br />
Uninsured<br />
4,000<br />
2,000<br />
0<br />
1998 2009<br />
<strong>Silicon</strong> <strong>Valley</strong><br />
1998 2009<br />
Rest <strong>of</strong> California<br />
ECONOMY 16 | 31<br />
Uninsured Population<br />
2007 2009<br />
SV 14% 18%<br />
CA 20% 24%<br />
Adult Obesity<br />
60%<br />
50%<br />
40%<br />
30%<br />
20%<br />
10%<br />
0%<br />
100%<br />
90%<br />
80%<br />
70%<br />
60%<br />
50%<br />
40%<br />
30%<br />
20%<br />
10%<br />
0%<br />
86%<br />
18%<br />
2005 2007<br />
Obese<br />
2007-08<br />
47%<br />
Graduation Rates<br />
16%<br />
31% 36%<br />
Overweight<br />
High School Graduation<br />
<strong>Silicon</strong> <strong>Valley</strong> High Schools<br />
87%<br />
2008-09<br />
Percentage <strong>of</strong> Graduates<br />
who Meet UC/CSU Requirements<br />
50%<br />
Average Sales Price (Inflation Adjusted)<br />
Fuel Consumption<br />
Gallons per Capita<br />
600<br />
500<br />
400<br />
300<br />
200<br />
100<br />
0<br />
-8%<br />
2000 2010<br />
<strong>Silicon</strong> <strong>Valley</strong><br />
Trends in Home Sales<br />
Average Sale Price and<br />
Number <strong>of</strong> Home Sales<br />
+10%<br />
2000 2010<br />
Rest <strong>of</strong> California<br />
$800,000 40,000<br />
20%<br />
15%<br />
10%<br />
600,000 30,000<br />
400,000 20,000<br />
200,000 10,000<br />
0 0<br />
2009<br />
Jan - Jun<br />
2010<br />
Number <strong>of</strong> Home Sales<br />
Average Sale Price<br />
Commercial Vacancy<br />
Annual Rate <strong>of</strong> Commercial Vacancy,<br />
All Commercial Space - Santa Clara County<br />
Number <strong>of</strong> Home Sales<br />
SOCIETY 32 | 43<br />
PLACE 44 | 57<br />
Special Analysis continued 58 | 67<br />
Appendices 68 | 72<br />
Acknowledgments | 73<br />
5%<br />
0%<br />
1998 2000 2002 2004 2006 2008 2010<br />
7


