

2011 Index of Silicon Valley - Silicon Valley Community Foundation
2011 Index of Silicon Valley - Silicon Valley Community Foundation
2011 Index of Silicon Valley - Silicon Valley Community Foundation

Create successful ePaper yourself
Turn your PDF publications into a flip-book with our unique Google optimized e-Paper software.
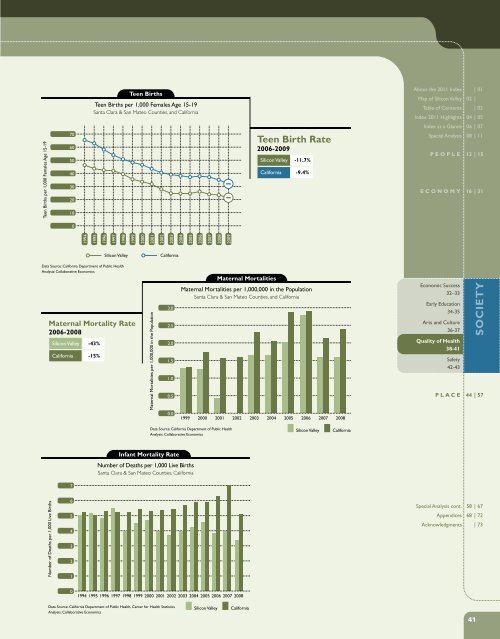
Teen Births<br />
Teen Births per 1,000 Females Age 15-19<br />
Santa Clara & San Mateo Counties, and California<br />
About the <strong>2011</strong> <strong>Index</strong> | 01<br />
Map <strong>of</strong> <strong>Silicon</strong> <strong>Valley</strong> 02 |<br />
Table <strong>of</strong> Contents | 03<br />
<strong>Index</strong> <strong>2011</strong> Highlights 04 | 05<br />
<strong>Index</strong> at a Glance 06 | 07<br />
Teen Births per 1,000 Females Age 15-19<br />
70<br />
60<br />
50<br />
40<br />
30<br />
20<br />
10<br />
Teen Birth Rate<br />
2006-2009<br />
<strong>Silicon</strong> <strong>Valley</strong> -11.7%<br />
California -9.4%<br />
Special Analysis 08 | 11<br />
PEOPLE 12 | 15<br />
ECONOMY 16 | 31<br />
0<br />
1994<br />
1995<br />
1996<br />
1997<br />
1998<br />
1999<br />
2000<br />
2001<br />
2002<br />
2003<br />
2004<br />
2005<br />
2006<br />
2007<br />
2008<br />
2009<br />
<strong>Silicon</strong> <strong>Valley</strong><br />
California<br />
Data Source: California Department <strong>of</strong> Public Health<br />
Analysis: Collaborative Economics<br />
Maternal Mortality Rate<br />
2006-2008<br />
<strong>Silicon</strong> <strong>Valley</strong> -43%<br />
California -15%<br />
Maternal Mortalities per 1,000,000 in the Population<br />
3.0<br />
2.5<br />
2.0<br />
1.5<br />
1.0<br />
0.5<br />
0.0<br />
Maternal Mortalities per 1,000,000 in the Population<br />
Santa Clara & San Mateo Counties, and California<br />
1999<br />
Maternal Mortalities<br />
2000 2001 2002 2003 2004 2005 2006 2007 2008<br />
Economic Success<br />
32–33<br />
Early Education<br />
34-35<br />
Arts and Culture<br />
36-37<br />
Quality <strong>of</strong> Health<br />
38-41<br />
Safety<br />
42-43<br />
SOCIETY<br />
PLACE 44 | 57<br />
Data Source: California Department <strong>of</strong> Public Health<br />
Analysis: Collaborative Economics<br />
<strong>Silicon</strong> <strong>Valley</strong><br />
California<br />
Infant Mortality Rate<br />
Number <strong>of</strong> Deaths per 1,000 Live Births<br />
Santa Clara & San Mateo Counties, California<br />
7<br />
Number <strong>of</strong> Deaths per 1,000 Live Births<br />
6<br />
5<br />
4<br />
3<br />
2<br />
1<br />
Special Analysis cont. 58 | 67<br />
Appendices 68 | 72<br />
Acknowledgments | 73<br />
0<br />
1994 1995 1996 1997 1998 1999 2000 2001 2002 2003 2004 2005 2006 2007 2008<br />
Data Source: California Department <strong>of</strong> Public Health, Center for Health Statistics<br />
Analysis: Collaborative Economics<br />
<strong>Silicon</strong> <strong>Valley</strong><br />
California<br />
41


