

2011 Index of Silicon Valley - Silicon Valley Community Foundation
2011 Index of Silicon Valley - Silicon Valley Community Foundation
2011 Index of Silicon Valley - Silicon Valley Community Foundation

Create successful ePaper yourself
Turn your PDF publications into a flip-book with our unique Google optimized e-Paper software.
Environment<br />
Progress is being made in improving<br />
the region’s environmental sustainability,<br />
but more gains are necessary.<br />
PLACE<br />
WHY IS THIS IMPORTANT<br />
Environmental quality directly affects the health <strong>of</strong> all residents and<br />
the ecosystem in the <strong>Silicon</strong> <strong>Valley</strong> region, which is in turn affected<br />
by the choices that residents make about how to live—how we<br />
chose to access work, other people, goods and services; where<br />
we build our homes; how we use our natural resources; and how<br />
we enforce environmental guidelines.<br />
Water is one <strong>of</strong> the region’s most precious resources, serving a<br />
multitude <strong>of</strong> needs, including drinking, recreation, supporting<br />
aquatic life and habitat, and agricultural and industrial uses. Water<br />
is also a limited resource because water supply is subject to<br />
changes in climate and state and federal regulations. Sustainability<br />
in the long run requires that households, workplaces and agricultural<br />
operations efficiently use and reuse water.<br />
Energy consumption impacts the environment with the emissions <strong>of</strong><br />
greenhouse gases and atmospheric pollutants through the<br />
combustion <strong>of</strong> fossil fuels. Sustainable energy policies include<br />
increasing energy efficiency and the use <strong>of</strong> clean renewable energy<br />
sources. For example, more widespread use <strong>of</strong> solar generated<br />
power diversifies the region’s electricity portfolio, increases the<br />
share <strong>of</strong> reliable and renewable electricity, and reduces greenhouse<br />
gasses and other harmful emissions. Electricity productivity<br />
illustrates the degree to which the region’s production <strong>of</strong> economic<br />
value is linked with its electricity consumption.<br />
The region’s total added solar capacity through the California Solar<br />
Initiative increased 18 percent from 2009 to 2010, and added<br />
capacity increased 35 percent in the rest <strong>of</strong> the state. This growth<br />
has been driven by the residential sector since 2007. Between<br />
2009 and 2010, residential solar increased 23 percent. Growth<br />
has not been as consistent for commercial solar installations.<br />
After peaking in 2008, added capacity slowed due to changes in<br />
public incentives and the economic downturn. Continued growth<br />
in residential installations is in part the result <strong>of</strong> changes in the<br />
federal tax credit implemented January 1, 2009 in which the cap<br />
<strong>of</strong> $2,000 was removed and credit given for 30 percent <strong>of</strong> the<br />
total installation cost. 8<br />
8 California Public Utilities Commission. “CPUS California Solar initiative: 2009 Impact Evaluation Final Report.” June 2010<br />
7<br />
6<br />
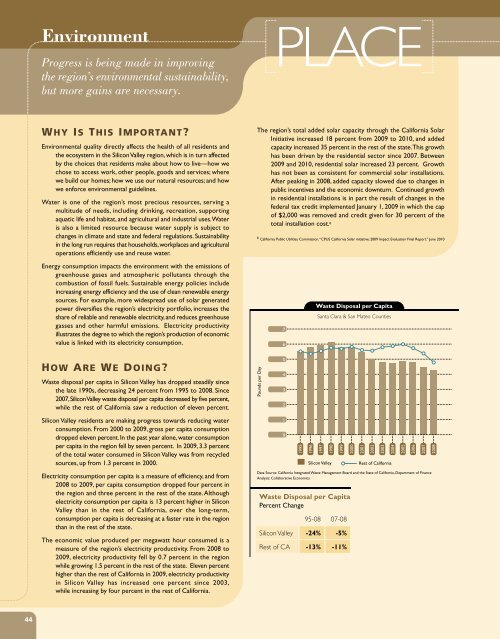
Waste Disposal per Capita<br />
Santa Clara & San Mateo Counties<br />
HOW ARE WE DOING<br />
Waste disposal per capita in <strong>Silicon</strong> <strong>Valley</strong> has dropped steadily since<br />
the late 1990s, decreasing 24 percent from 1995 to 2008. Since<br />
2007, <strong>Silicon</strong> <strong>Valley</strong> waste disposal per capita decreased by five percent,<br />
while the rest <strong>of</strong> California saw a reduction <strong>of</strong> eleven percent.<br />
<strong>Silicon</strong> <strong>Valley</strong> residents are making progress towards reducing water<br />
consumption. From 2000 to 2009, gross per capita consumption<br />
dropped eleven percent. In the past year alone, water consumption<br />
per capita in the region fell by seven percent. In 2009, 3.3 percent<br />
<strong>of</strong> the total water consumed in <strong>Silicon</strong> <strong>Valley</strong> was from recycled<br />
sources, up from 1.3 percent in 2000.<br />
Electricity consumption per capita is a measure <strong>of</strong> efficiency, and from<br />
2008 to 2009, per capita consumption dropped four percent in<br />
the region and three percent in the rest <strong>of</strong> the state. Although<br />
electricity consumption per capita is 13 percent higher in <strong>Silicon</strong><br />
<strong>Valley</strong> than in the rest <strong>of</strong> California, over the long-term,<br />
consumption per capita is decreasing at a faster rate in the region<br />
than in the rest <strong>of</strong> the state.<br />
The economic value produced per megawatt hour consumed is a<br />
measure <strong>of</strong> the region’s electricity productivity. From 2008 to<br />
2009, electricity productivity fell by 0.7 percent in the region<br />
while growing 1.5 percent in the rest <strong>of</strong> the state. Eleven percent<br />
higher than the rest <strong>of</strong> California in 2009, electricity productivity<br />
in <strong>Silicon</strong> <strong>Valley</strong> has increased one percent since 2003,<br />
while increasing by four percent in the rest <strong>of</strong> California.<br />
Pounds per Day<br />
5<br />
4<br />
3<br />
2<br />
1<br />
0<br />
1995<br />
1996<br />
1997<br />
1998<br />
<strong>Silicon</strong> <strong>Valley</strong><br />
1999<br />
Data Source: California Integrated Waste Management Board and the State <strong>of</strong> California, Department <strong>of</strong> Finance<br />
Analysis: Collaborative Economics<br />
Waste Disposal per Capita<br />
Percent Change<br />
95-08 07-08<br />
<strong>Silicon</strong> <strong>Valley</strong> -24% -5%<br />
Rest <strong>of</strong> CA -13% -11%<br />
2000<br />
2001<br />
2002<br />
2003<br />
Rest <strong>of</strong> California<br />
2004<br />
2005<br />
2006<br />
2007<br />
2008<br />
44


