

2011 Index of Silicon Valley - Silicon Valley Community Foundation
2011 Index of Silicon Valley - Silicon Valley Community Foundation
2011 Index of Silicon Valley - Silicon Valley Community Foundation

You also want an ePaper? Increase the reach of your titles
YUMPU automatically turns print PDFs into web optimized ePapers that Google loves.
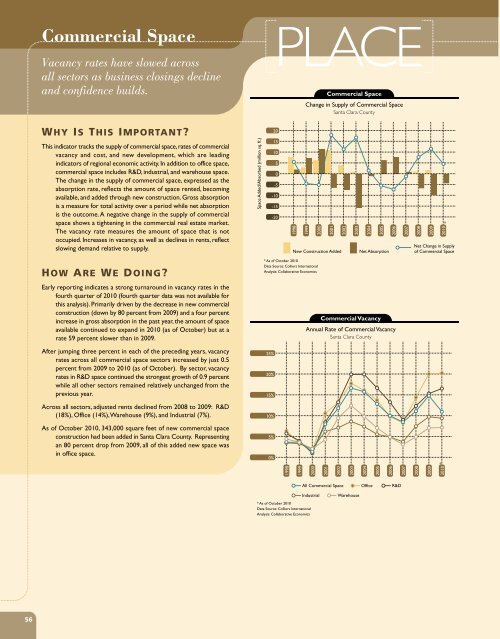
Commercial Space<br />
Vacancy rates have slowed across<br />
all sectors as business closings decline<br />
and confidence builds.<br />
PLACE<br />
Commercial Space<br />
Change in Supply <strong>of</strong> Commercial Space<br />
Santa Clara County<br />
WHY IS THIS IMPORTANT<br />
This indicator tracks the supply <strong>of</strong> commercial space, rates <strong>of</strong> commercial<br />
vacancy and cost, and new development, which are leading<br />
indicators <strong>of</strong> regional economic activity. In addition to <strong>of</strong>fice space,<br />
commercial space includes R&D, industrial, and warehouse space.<br />
The change in the supply <strong>of</strong> commercial space, expressed as the<br />
absorption rate, reflects the amount <strong>of</strong> space rented, becoming<br />
available, and added through new construction. Gross absorption<br />
is a measure for total activity over a period while net absorption<br />
is the outcome. A negative change in the supply <strong>of</strong> commercial<br />
space shows a tightening in the commercial real estate market.<br />
The vacancy rate measures the amount <strong>of</strong> space that is not<br />
occupied. Increases in vacancy, as well as declines in rents, reflect<br />
slowing demand relative to supply.<br />
Space Added/Absorbed (million sq. ft.)<br />
20<br />
15<br />
10<br />
5<br />
0<br />
-5<br />
-10<br />
-15<br />
-20<br />
1998<br />
1999<br />
2000<br />
2001<br />
2002<br />
New Construction Added<br />
2003<br />
2004<br />
2005<br />
2006<br />
Net Absorption<br />
2007<br />
2008<br />
2009<br />
*<br />
2010<br />
Net Change in Supply<br />
<strong>of</strong> Commercial Space<br />
HOW ARE WE DOING<br />
Early reporting indicates a strong turnaround in vacancy rates in the<br />
fourth quarter <strong>of</strong> 2010 (fourth quarter data was not available for<br />
this analysis). Primarily driven by the decrease in new commercial<br />
construction (down by 80 percent from 2009) and a four percent<br />
increase in gross absorption in the past year, the amount <strong>of</strong> space<br />
available continued to expand in 2010 (as <strong>of</strong> October) but at a<br />
rate 59 percent slower than in 2009.<br />
After jumping three percent in each <strong>of</strong> the preceding years, vacancy<br />
rates across all commercial space sectors increased by just 0.5<br />
percent from 2009 to 2010 (as <strong>of</strong> October). By sector, vacancy<br />
rates in R&D space continued the strongest growth <strong>of</strong> 0.9 percent<br />
while all other sectors remained relatively unchanged from the<br />
previous year.<br />
Across all sectors, adjusted rents declined from 2008 to 2009: R&D<br />
(18%), Office (14%), Warehouse (9%), and Industrial (7%).<br />
As <strong>of</strong> October 2010, 343,000 square feet <strong>of</strong> new commercial space<br />
construction had been added in Santa Clara County. Representing<br />
an 80 percent drop from 2009, all <strong>of</strong> this added new space was<br />
in <strong>of</strong>fice space.<br />
* As <strong>of</strong> October 2010<br />
Data Source: Colliers International<br />
Analysis: Collaborative Economics<br />
25%<br />
20%<br />
15%<br />
10%<br />
5%<br />
0%<br />
Commercial Vacancy<br />
Annual Rate <strong>of</strong> Commercial Vacancy<br />
Santa Clara County<br />
1998<br />
2000<br />
2001<br />
2002<br />
2003<br />
2004<br />
2005<br />
2006<br />
2007<br />
2008<br />
1999<br />
2010<br />
2009<br />
*<br />
All Commercial Space<br />
Office<br />
R&D<br />
Industrial<br />
* As <strong>of</strong> October 2010<br />
Data Source: Colliers International<br />
Analysis: Collaborative Economics<br />
Warehouse<br />
56


