

2011 Index of Silicon Valley - Silicon Valley Community Foundation
2011 Index of Silicon Valley - Silicon Valley Community Foundation
2011 Index of Silicon Valley - Silicon Valley Community Foundation

You also want an ePaper? Increase the reach of your titles
YUMPU automatically turns print PDFs into web optimized ePapers that Google loves.
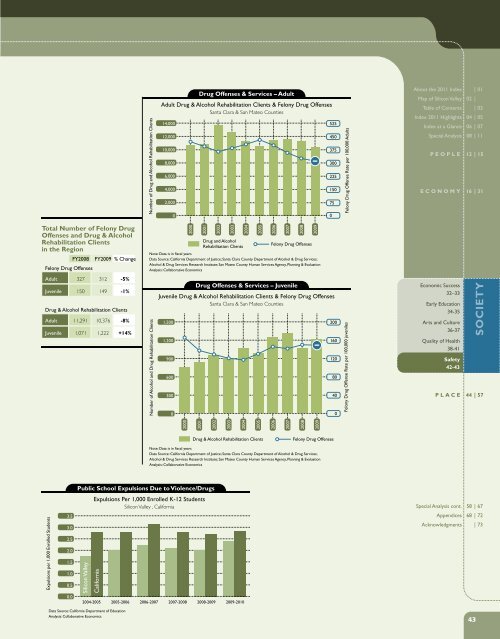
Number <strong>of</strong> Drug and Alcohol Rehabilitation Clients<br />
14,000 525<br />
12,000<br />
10,000<br />
8,000<br />
6,000<br />
4,000<br />
2,000<br />
0<br />
Drug Offenses & Services – Adult<br />
Adult Drug & Alcohol Rehabilitation Clients & Felony Drug Offenses<br />
Santa Clara & San Mateo Counties<br />
450<br />
375<br />
300<br />
225<br />
150<br />
75<br />
0<br />
Felony Drug Offense Rate per 100,000 Adults<br />
About the <strong>2011</strong> <strong>Index</strong> | 01<br />
Map <strong>of</strong> <strong>Silicon</strong> <strong>Valley</strong> 02 |<br />
Table <strong>of</strong> Contents | 03<br />
<strong>Index</strong> <strong>2011</strong> Highlights 04 | 05<br />
<strong>Index</strong> at a Glance 06 | 07<br />
Special Analysis 08 | 11<br />
PEOPLE 12 | 15<br />
ECONOMY 16 | 31<br />
Total Number <strong>of</strong> Felony Drug<br />
Offenses and Drug & Alcohol<br />
Rehabilitation Clients<br />
in the Region<br />
FY2008<br />
Felony Drug Offenses<br />
FY2009 % Change<br />
2000<br />
2001<br />
2002<br />
2003<br />
Drug and Alcohol<br />
Rehabilitation Clients<br />
2004<br />
2005<br />
2006<br />
Felony Drug Offenses<br />
Note: Data is in fiscal years<br />
Data Source: California Department <strong>of</strong> Justice; Santa Clara County Department <strong>of</strong> Alcohol & Drug Services;<br />
Alcohol & Drug Services Research Institute; San Mateo County Human Services Agency, Planning & Evaluation<br />
Analysis: Collaborative Economics<br />
2007<br />
2008<br />
2009<br />
Adult 327 312 -5%<br />
Juvenile 150 149 -1%<br />
Drug & Alcohol Rehabilitation Clients<br />
Adult 11,291 10,376 -8%<br />
Juvenile 1,071 1,222 +14%<br />
Number <strong>of</strong> Alcohol and Drug Rehabilitation Clients<br />
Juvenile Drug & Alcohol Rehabilitation Clients & Felony Drug Offenses<br />
Santa Clara & San Mateo Counties<br />
1,500<br />
1,200<br />
900<br />
600<br />
300<br />
0<br />
Drug Offenses & Services – Juvenile<br />
200<br />
160<br />
120<br />
80<br />
40<br />
Economic Success<br />
32–33<br />
Early Education<br />
34-35<br />
Arts and Culture<br />
36-37<br />
Quality <strong>of</strong> Health<br />
38-41<br />
Safety<br />
42-43<br />
SOCIETY<br />
PLACE 44 | 57<br />
2000<br />
2001<br />
2002<br />
2003<br />
0<br />
2004<br />
2005<br />
2006<br />
2007<br />
Felony Drug Offense Rate per 100,000 juveniles<br />
2009<br />
2008<br />
Drug & Alcohol Rehabilitation Clients<br />
Felony Drug Offenses<br />
Note: Data is in fiscal years<br />
Data Source: California Department <strong>of</strong> Justice; Santa Clara County Department <strong>of</strong> Alcohol & Drug Services;<br />
Alcohol & Drug Services Research Institute; San Mateo County Human Services Agency, Planning & Evaluation<br />
Analysis: Collaborative Economics<br />
Public School Expulsions Due to Violence/Drugs<br />
Expulsions Per 1,000 Enrolled K-12 Students<br />
<strong>Silicon</strong> <strong>Valley</strong> , California<br />
Special Analysis cont. 58 | 67<br />
Expulsions per 1,000 Enrolled Students<br />
3.5<br />
3.0<br />
2.5<br />
2.0<br />
1.5<br />
1.0<br />
0.5<br />
0.0<br />
<strong>Silicon</strong> <strong>Valley</strong><br />
California<br />
2004-2005<br />
2005-2006 2006-2007 2007-2008 2008-2009 2009-2010<br />
Appendices 68 | 72<br />
Acknowledgments | 73<br />
Data Source: California Department <strong>of</strong> Education<br />
Analysis: Collaborative Economics<br />
43


