

2011 Index of Silicon Valley - Silicon Valley Community Foundation
2011 Index of Silicon Valley - Silicon Valley Community Foundation
2011 Index of Silicon Valley - Silicon Valley Community Foundation

You also want an ePaper? Increase the reach of your titles
YUMPU automatically turns print PDFs into web optimized ePapers that Google loves.
Housing<br />
The region is still bearing the impact<br />
<strong>of</strong> the housing crisis as home sales<br />
plummet and foreclosures slow.<br />
PLACE<br />
WHY IS THIS IMPORTANT<br />
The affordability <strong>of</strong> housing affects a region’s ability to maintain a viable<br />
economy and high quality <strong>of</strong> life. Lack <strong>of</strong> affordable housing in a<br />
region encourages longer commutes, which diminish productivity,<br />
curtail family time and increase traffic congestion. Lack <strong>of</strong> affordable<br />
housing also restricts the ability <strong>of</strong> crucial service providers—<br />
such as teachers, registered nurses and police <strong>of</strong>ficers—to live<br />
in the communities in which they work. The current financial<br />
crisis has greatly added to housing pressures in the region.<br />
HOW ARE WE DOING<br />
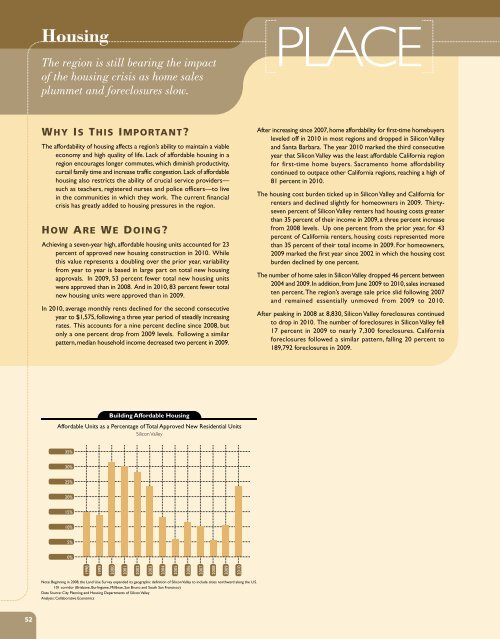
Achieving a seven-year high, affordable housing units accounted for 23<br />
percent <strong>of</strong> approved new housing construction in 2010. While<br />
this value represents a doubling over the prior year, variability<br />
from year to year is based in large part on total new housing<br />
approvals. In 2009, 53 percent fewer total new housing units<br />
were approved than in 2008. And in 2010, 83 percent fewer total<br />
new housing units were approved than in 2009.<br />
In 2010, average monthly rents declined for the second consecutive<br />
year to $1,575, following a three year period <strong>of</strong> steadily increasing<br />
rates. This accounts for a nine percent decline since 2008, but<br />
only a one percent drop from 2009 levels. Following a similar<br />
pattern, median household income decreased two percent in 2009.<br />
After increasing since 2007, home affordability for first-time homebuyers<br />
leveled <strong>of</strong>f in 2010 in most regions and dropped in <strong>Silicon</strong> <strong>Valley</strong><br />
and Santa Barbara. The year 2010 marked the third consecutive<br />
year that <strong>Silicon</strong> <strong>Valley</strong> was the least affordable California region<br />
for first-time home buyers. Sacramento home affordability<br />
continued to outpace other California regions, reaching a high <strong>of</strong><br />
81 percent in 2010.<br />
The housing cost burden ticked up in <strong>Silicon</strong> <strong>Valley</strong> and California for<br />
renters and declined slightly for homeowners in 2009. Thirtyseven<br />
percent <strong>of</strong> <strong>Silicon</strong> <strong>Valley</strong> renters had housing costs greater<br />
than 35 percent <strong>of</strong> their income in 2009, a three percent increase<br />
from 2008 levels. Up one percent from the prior year, for 43<br />
percent <strong>of</strong> California renters, housing costs represented more<br />
than 35 percent <strong>of</strong> their total income in 2009. For homeowners,<br />
2009 marked the first year since 2002 in which the housing cost<br />
burden declined by one percent.<br />
The number <strong>of</strong> home sales in <strong>Silicon</strong> <strong>Valley</strong> dropped 46 percent between<br />
2004 and 2009. In addition, from June 2009 to 2010, sales increased<br />
ten percent. The region’s average sale price slid following 2007<br />
and remained essentially unmoved from 2009 to 2010.<br />
After peaking in 2008 at 8,830, <strong>Silicon</strong> <strong>Valley</strong> foreclosures continued<br />
to drop in 2010. The number <strong>of</strong> foreclosures in <strong>Silicon</strong> <strong>Valley</strong> fell<br />
17 percent in 2009 to nearly 7,300 foreclosures. California<br />
foreclosures followed a similar pattern, falling 20 percent to<br />
189,792 foreclosures in 2009.<br />
Building Affordable Housing<br />
Affordable Units as a Percentage <strong>of</strong> Total Approved New Residential Units<br />
<strong>Silicon</strong> <strong>Valley</strong><br />
35%<br />
30%<br />
25%<br />
20%<br />
15%<br />
10%<br />
5%<br />
0%<br />
1998<br />
1999<br />
2000<br />
2001<br />
2002<br />
2003<br />
2004<br />
2005<br />
2006<br />
2007<br />
2008<br />
2009<br />
2010<br />
Note: Beginning in 2008, the Land Use Survey expanded its geographic definition <strong>of</strong> <strong>Silicon</strong> <strong>Valley</strong> to include cities northward along the U.S.<br />
101 corridor (Brisbane, Burlingame, Millbrae, San Bruno and South San Francisco)<br />
Data Source: City Planning and Housing Departments <strong>of</strong> <strong>Silicon</strong> <strong>Valley</strong><br />
Analysis: Collaborative Economics<br />
52


