

2011 Index of Silicon Valley - Silicon Valley Community Foundation
2011 Index of Silicon Valley - Silicon Valley Community Foundation
2011 Index of Silicon Valley - Silicon Valley Community Foundation

Create successful ePaper yourself
Turn your PDF publications into a flip-book with our unique Google optimized e-Paper software.
Special Analysis<br />
The Crisis in Local Government and Choices Facing Our Communities<br />
Understanding the Challenge<br />
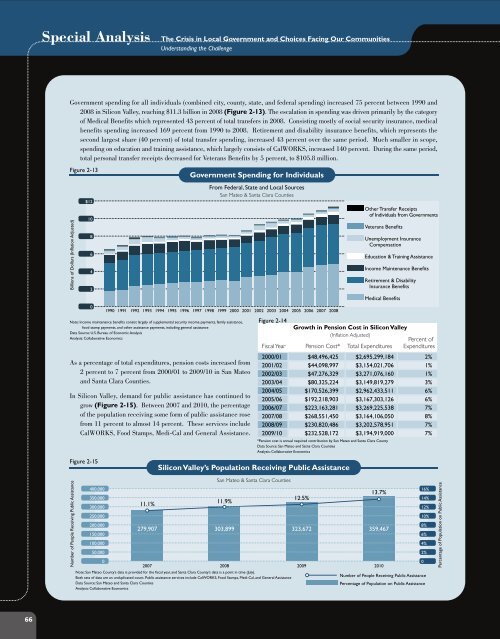
Government spending for all individuals (combined city, county, state, and federal spending) increased 75 percent between 1990 and<br />
2008 in <strong>Silicon</strong> <strong>Valley</strong>, reaching $11.3 billion in 2008 (Figure 2-13). The escalation in spending was driven primarily by the category<br />
<strong>of</strong> Medical Benefits which represented 43 percent <strong>of</strong> total transfers in 2008. Consisting mostly <strong>of</strong> social security insurance, medical<br />
benefits spending increased 169 percent from 1990 to 2008. Retirement and disability insurance benefits, which represents the<br />
second largest share (40 percent) <strong>of</strong> total transfer spending, increased 43 percent over the same period. Much smaller in scope,<br />
spending on education and training assistance, which largely consists <strong>of</strong> CalWORKS, increased 140 percent. During the same period,<br />
total personal transfer receipts decreased for Veterans Benefits by 5 percent, to $105.8 million.<br />
Figure 2-13<br />
Billions <strong>of</strong> Dollars (Inflation Adjusted)<br />
$12<br />
10<br />
8<br />
6<br />
4<br />
2<br />
0<br />
1990 1991 1992 1993 1994 1995 1996 1997 1998 1999 2000 2001 2002 2003 2004 2005 2006 2007 2008<br />
Note: Income maintenance benefits consist largely <strong>of</strong> supplemental security income payments, family assistance,<br />
food stamp payments, and other assistance payments, including general assistance<br />
Data Source: U.S. Bureau <strong>of</strong> Economic Analysis<br />
Analysis: Collaborative Economics<br />
As a percentage <strong>of</strong> total expenditures, pension costs increased from<br />
2 percent to 7 percent from 2000/01 to 2009/10 in San Mateo<br />
and Santa Clara Counties.<br />
In <strong>Silicon</strong> <strong>Valley</strong>, demand for public assistance has continued to<br />
grow (Figure 2-15). Between 2007 and 2010, the percentage<br />
<strong>of</strong> the population receiving some form <strong>of</strong> public assistance rose<br />
from 11 percent to almost 14 percent. These services include<br />
CalWORKS, Food Stamps, Medi-Cal and General Assistance.<br />
Figure 2-15<br />
Government Spending for Individuals<br />
From Federal, State and Local Sources<br />
San Mateo & Santa Clara Counties<br />
*Pension cost is annual required contribution by San Mateo and Santa Clara County<br />
Data Source: San Mateo and Satna Clara Counties<br />
Analysis: Collaborative Economics<br />
Other Transfer Receipts<br />
<strong>of</strong> Individuals from Governments<br />
Veterans Benefits<br />
Unemployment Insurance<br />
Compensation<br />
Education & Training Assistance<br />
Income Maintenance Benefits<br />
Retirement & Disability<br />
Insurance Benefits<br />
Medical Benefits<br />
Figure 2-14<br />
Growth in Pension Cost in <strong>Silicon</strong> <strong>Valley</strong><br />
(Inflation Adjusted)<br />
Percent <strong>of</strong><br />
Fiscal Year Pension Cost* Total Expenditures Expenditures<br />
2000/01 $48,496,425 $2,695,299,184 2%<br />
2001/02 $44,098,997 $3,154,021,706 1%<br />
2002/03 $47,276,329 $3,271,076,160 1%<br />
2003/04 $80,325,224 $3,149,819,279 3%<br />
2004/05 $170,526,399 $2,962,433,511 6%<br />
2005/06 $192,218,903 $3,167,303,126 6%<br />
2006/07 $223,163,281 $3,269,225,538 7%<br />
2007/08 $268,551,450 $3,164,106,050 8%<br />
2008/09 $230,820,486 $3,202,578,951 7%<br />
2009/10 $232,528,172 $3,194,919,000 7%<br />
<strong>Silicon</strong> <strong>Valley</strong>’s Population Receiving Public Assistance<br />
Number <strong>of</strong> People Receiving Public Assistance<br />
400,000<br />
350,000<br />
300,000<br />
250,000<br />
200,000<br />
150,000<br />
100,000<br />
50,000<br />
0<br />
11.1%<br />
279,907<br />
11.9%<br />
303,899<br />
2007 2008<br />
San Mateo & Santa Clara Counties<br />
Note: San Mateo County’s data is provided for the fiscal year, and Santa Clara County’s data is a point in time (July).<br />
Both sets <strong>of</strong> data are an unduplicated count. Public assistance services include CalWORKS, Food Stamps, Medi-Cal, and General Assistance<br />
Data Source: San Mateo and Santa Clara Counties<br />
Analysis: Collaborative Economics<br />
12.5%<br />
323,672<br />
13.7%<br />
359,467<br />
2009 2010<br />
Number <strong>of</strong> People Receiving Public Assistance<br />
Percentage <strong>of</strong> Population on Public Assistance<br />
16%<br />
14%<br />
12%<br />
10%<br />
8%<br />
6%<br />
4%<br />
2%<br />
0<br />
Percentage <strong>of</strong> Population on Public Assistance<br />
66


