

2011 Index of Silicon Valley - Silicon Valley Community Foundation
2011 Index of Silicon Valley - Silicon Valley Community Foundation
2011 Index of Silicon Valley - Silicon Valley Community Foundation

Create successful ePaper yourself
Turn your PDF publications into a flip-book with our unique Google optimized e-Paper software.
Trends in County Revenue and Expenditures<br />
The economic downturn has created increased demand for vital safety net services, many <strong>of</strong> which are provided by county government.<br />
The rising demand, combined with increasing expenses, has resulted in growing deficits in San Mateo and Santa Clara Counties and<br />
resulting cuts <strong>of</strong> public programs and services at precisely the time these services are most needed.<br />
County governments provide public services similar to those provided<br />
by cities, but operate as agents <strong>of</strong> state government within<br />
constitutional and statutory restrictions that limit their ability<br />
to raise new revenues. This characterizes a major difference<br />
between city and county governments. Because they administer<br />
largely state-mandated health and human service programs, the<br />
region’s counties are increasingly squeezed as revenues drop<br />
while demand for services continues to rise.<br />
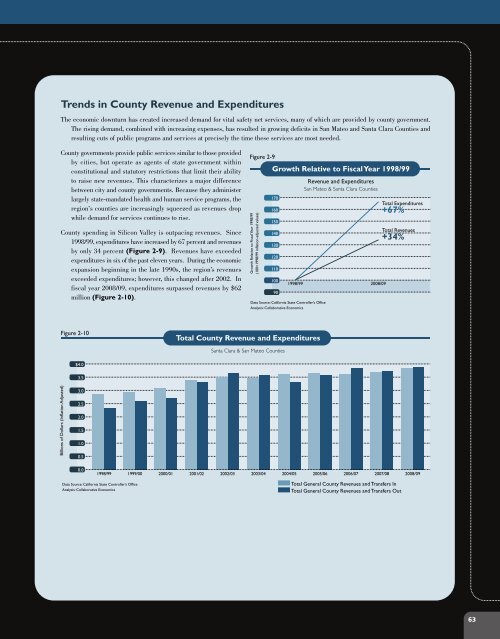
County spending in <strong>Silicon</strong> <strong>Valley</strong> is outpacing revenues. Since<br />
1998/99, expenditures have increased by 67 percent and revenues<br />
by only 34 percent (Figure 2-9). Revenues have exceeded<br />
expenditures in six <strong>of</strong> the past eleven years. During the economic<br />
expansion beginning in the late 1990s, the region’s revenues<br />
exceeded expenditures; however, this changed after 2002. In<br />
fiscal year 2008/09, expenditures surpassed revenues by $62<br />
million (Figure 2-10).<br />
Figure 2-9<br />
Growth Relative to Fiscal Year 1998/99<br />
(100=1998/99 inflation-adjusted values)<br />
Growth Relative to Fiscal Year 1998/99<br />
170<br />
160<br />
150<br />
140<br />
130<br />
120<br />
110<br />
100<br />
90<br />
Data Source: California State Controller’s Office<br />
Analysis: Collaborative Economics<br />
Revenue and Expenditures<br />
San Mateo & Santa Clara Counties<br />
1998/99 2008/09<br />
Total Expenditures<br />
+67%<br />
Total Revenues<br />
+34%<br />
Figure 2-10<br />
Total County Revenue and Expenditures<br />
Santa Clara & San Mateo Counties<br />
$4.0<br />
3.5<br />
Billions <strong>of</strong> Dollars (Inflation Adjusted)<br />
3.0<br />
2.5<br />
2.0<br />
1.5<br />
1.0<br />
0.5<br />
0.0<br />
1998/99 1999/00 2000/01 2001/02 2002/03 2003/04 2004/05 2005/06 2006/07 2007/08 2008/09<br />
Data Source: California State Controller’s Office<br />
Analysis: Collaborative Economics<br />
Total General County Revenues and Transfers In<br />
Total General County Revenues and Transfers Out<br />
63


