

2011 Index of Silicon Valley - Silicon Valley Community Foundation
2011 Index of Silicon Valley - Silicon Valley Community Foundation
2011 Index of Silicon Valley - Silicon Valley Community Foundation

You also want an ePaper? Increase the reach of your titles
YUMPU automatically turns print PDFs into web optimized ePapers that Google loves.
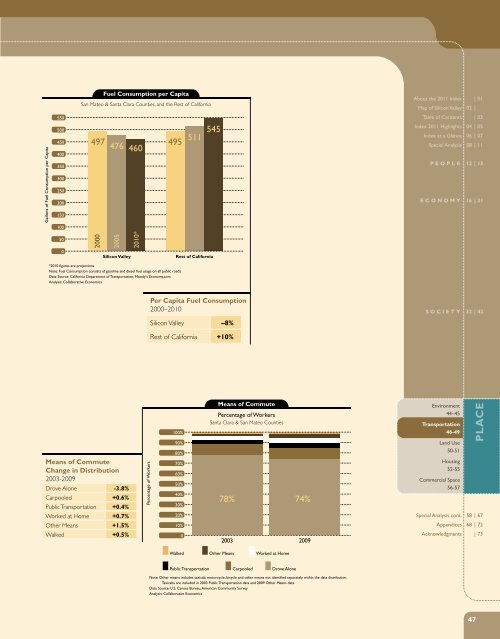
Fuel Consumption per Capita<br />
San Mateo & Santa Clara Counties, and the Rest <strong>of</strong> California<br />
About the <strong>2011</strong> <strong>Index</strong> | 01<br />
Map <strong>of</strong> <strong>Silicon</strong> <strong>Valley</strong> 02 |<br />
550<br />
Table <strong>of</strong> Contents | 03<br />
Gallons <strong>of</strong> Fuel Consumption per Capita<br />
500<br />
450<br />
400<br />
350<br />
300<br />
250<br />
200<br />
150<br />
497<br />
476 460<br />
495<br />
511<br />
545<br />
<strong>Index</strong> <strong>2011</strong> Highlights 04 | 05<br />
<strong>Index</strong> at a Glance 06 | 07<br />
Special Analysis 08 | 11<br />
PEOPLE 12 | 15<br />
ECONOMY 16 | 31<br />
100<br />
50<br />
2000<br />
2005<br />
2010*<br />
0<br />
<strong>Silicon</strong> <strong>Valley</strong><br />
Rest <strong>of</strong> California<br />
*2010 figures are projections<br />
Note: Fuel Consumption consists <strong>of</strong> gasoline and diesel fuel usage on all public roads<br />
Data Source: California Department <strong>of</strong> Transportation; Moody's Economy.com<br />
Analysis: Collaborative Economics<br />
Per Capita Fuel Consumption<br />
2000–2010<br />
<strong>Silicon</strong> <strong>Valley</strong> –8%<br />
SOCIETY 32 | 43<br />
Rest <strong>of</strong> California +10%<br />
Means <strong>of</strong> Commute<br />
Change in Distribution<br />
2003-2009<br />
Drove Alone -3.8%<br />
Carpooled +0.6%<br />
Public Transportation +0.4%<br />
Percentage <strong>of</strong> Workers<br />
100%<br />
90%<br />
80%<br />
70%<br />
60%<br />
50%<br />
40%<br />
30%<br />
Means <strong>of</strong> Commute<br />
Percentage <strong>of</strong> Workers<br />
Santa Clara & San Mateo Counties<br />
78% 74%<br />
Environment<br />
44–45<br />
Transportation<br />
46-49<br />
Land Use<br />
50-51<br />
Housing<br />
52-55<br />
Commercial Space<br />
56-57<br />
PLACE<br />
Worked at Home +0.7%<br />
20%<br />
Special Analysis cont. 58 | 67<br />
Other Means +1.5%<br />
10%<br />
Appendices 68 | 72<br />
Walked +0.5%<br />
0<br />
2003 2009<br />
Acknowledgments | 73<br />
Walked<br />
Other Means<br />
Worked at Home<br />
Public Transportation<br />
Carpooled<br />
Drove Alone<br />
Note: Other means includes taxicab, motorcycle, bicycle and other means not identified separately within the data distribution.<br />
Taxicabs are included in 2003 Public Transportation data and 2009 Other Means data.<br />
Data Source: U.S. Census Bureau, American <strong>Community</strong> Survey<br />
Analysis: Collaborative Economics<br />
47


