

2011 Index of Silicon Valley - Silicon Valley Community Foundation
2011 Index of Silicon Valley - Silicon Valley Community Foundation
2011 Index of Silicon Valley - Silicon Valley Community Foundation

You also want an ePaper? Increase the reach of your titles
YUMPU automatically turns print PDFs into web optimized ePapers that Google loves.
Special Analysis The Crisis in Local Government and Choices Facing Our Communities<br />
Understanding the Challenge<br />
continued from page 11<br />
Local Finance Trends: Revenues, Spending, and Deficits<br />
City and county governments provide essential public services that enable a thriving community and growing economy. These services<br />
include public safety (police, fire, and emergency services), the justice system, social services, parks and recreation, and land use<br />
planning. City and county governments both maintain roads, water systems and sewers, waste disposal and in some cases electric<br />
utilities. County governments have the additional role <strong>of</strong> administering state and federal programs, such as child protective services,<br />
public health, adult and juvenile detention and probation, and elections. Funding for these services comes from a variety <strong>of</strong> sources.<br />
The actual mix <strong>of</strong> funding is different for cities and counties based on the different roles they play in our system <strong>of</strong> government and<br />
can vary from county-to-county and city-to-city.<br />
The current economic downturn has put tremendous pressure on city and county governments that are faced with declining revenues<br />
and increasing demand for public services. Maintaining a mix <strong>of</strong> stable and more elastic revenue sources has traditionally helped<br />
communities buffer themselves from the ups and downs <strong>of</strong> the business cycle. While sales tax revenue declines when the economy<br />
slows (as consumer spending declines), property tax revenue has traditionally served as a significant and stable source <strong>of</strong> local revenue<br />
until the latest recession. Unfortunately, the bursting <strong>of</strong> the housing bubble and the related foreclosure crisis has led to steep declines<br />
in property values and county revenue from property taxes.<br />
In addition to the increased exposure to economic cycles, communities made substantial commitments in the way <strong>of</strong> salaries and benefits<br />
to attract employees during the economic expansion <strong>of</strong> the late 1990s. These are long-term commitments that are difficult to roll back<br />
without affecting current and future employees, but the resulting problem <strong>of</strong> future unfunded pension and retiree health obligations<br />
is hitting local governments across the nation. 4<br />
Trends in City Revenue<br />
and Expenditures<br />
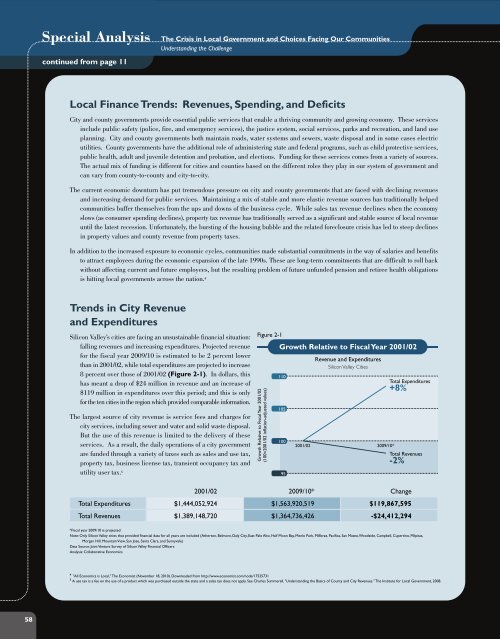
<strong>Silicon</strong> <strong>Valley</strong>’s cities are facing an unsustainable financial situation:<br />
falling revenues and increasing expenditures. Projected revenue<br />
for the fiscal year 2009/10 is estimated to be 2 percent lower<br />
than in 2001/02, while total expenditures are projected to increase<br />
8 percent over those <strong>of</strong> 2001/02 (Figure 2-1). In dollars, this<br />
has meant a drop <strong>of</strong> $24 million in revenue and an increase <strong>of</strong><br />
$119 million in expenditures over this period; and this is only<br />
for the ten cities in the region which provided comparable information.<br />
The largest source <strong>of</strong> city revenue is service fees and charges for<br />
city services, including sewer and water and solid waste disposal.<br />
But the use <strong>of</strong> this revenue is limited to the delivery <strong>of</strong> these<br />
services. As a result, the daily operations <strong>of</strong> a city government<br />
are funded through a variety <strong>of</strong> taxes such as sales and use tax,<br />
property tax, business license tax, transient occupancy tax and<br />
utility user tax. 5<br />
Figure 2-1<br />
Growth Relative to Fiscal Year 2001/02<br />
(100=2001/02 inflation-adjusted values)<br />
Growth Relative to Fiscal Year 2001/02<br />
110<br />
105<br />
100<br />
95<br />
Revenue and Expenditures<br />
<strong>Silicon</strong> <strong>Valley</strong> Cities<br />
2001/02 2009/10*<br />
Total Expenditures<br />
+8%<br />
Total Revenues<br />
-2%<br />
2001/02 2009/10* Change<br />
Total Expenditures $1,444,052,924 $1,563,920,519 $119,867,595<br />
Total Revenues $1,389,148,720 $1,364,736,426 -$24,412,294<br />
*Fiscal year 2009/10 is projected<br />
Note: Only <strong>Silicon</strong> <strong>Valley</strong> cities that provided financial data for all years are included (Atherton, Belmont, Daly City, East Palo Alto, Half Moon Bay, Menlo Park, Millbrae, Pacifica, San Mateo, Woodside, Campbell, Cupertino, Milpitas,<br />
Morgan Hill, Mountain View, San Jose, Santa Clara, and Sunnyvale)<br />
Data Source: Joint Venture Survey <strong>of</strong> <strong>Silicon</strong> <strong>Valley</strong> Financial Officers<br />
Analysis: Collaborative Economics<br />
4 "All Economics is Local," The Economist (November 18, 2010). Downloaded from http://www.economist.com/node/17525731<br />
5 A use tax is a fee on the use <strong>of</strong> a product which was purchased outside the state and a sales tax does not apply. See Charles Summerell, "Understanding the Basics <strong>of</strong> County and City Revenues." The Institute for Local Government, 2008.<br />
58


