

2011 Index of Silicon Valley - Silicon Valley Community Foundation
2011 Index of Silicon Valley - Silicon Valley Community Foundation
2011 Index of Silicon Valley - Silicon Valley Community Foundation

Create successful ePaper yourself
Turn your PDF publications into a flip-book with our unique Google optimized e-Paper software.
MY<br />
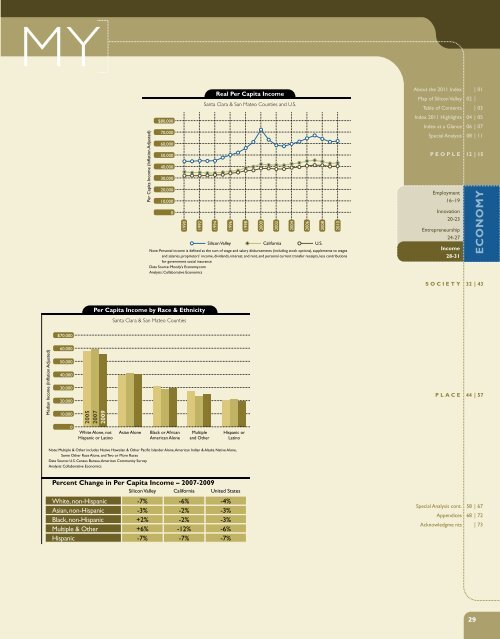
Per Capita Income (Inflation Adjusted)<br />
$80,000<br />
70,000<br />
60,000<br />
50,000<br />
40,000<br />
30,000<br />
20,000<br />
10,000<br />
0<br />
1990<br />
1992<br />
Santa Clara & San Mateo Counties and U.S.<br />
1994<br />
Real Per Capita Income<br />
1996<br />
<strong>Silicon</strong> <strong>Valley</strong><br />
1998<br />
2000<br />
2002<br />
California<br />
Note: Personal income is defined as the sum <strong>of</strong> wage and salary disbursements (including stock options), supplements to wages<br />
and salaries, proprietors’ income, dividends, interest, and rent, and personal current transfer receipts, less contributions<br />
for government social insurance<br />
Data Source: Moody’s Economy.com<br />
Analysis: Collaborative Economics<br />
2004<br />
2006<br />
2008<br />
U.S.<br />
2010<br />
About the <strong>2011</strong> <strong>Index</strong> | 01<br />
Map <strong>of</strong> <strong>Silicon</strong> <strong>Valley</strong> 02 |<br />
Table <strong>of</strong> Contents | 03<br />
<strong>Index</strong> <strong>2011</strong> Highlights 04 | 05<br />
<strong>Index</strong> at a Glance 06 | 07<br />
Special Analysis 08 | 11<br />
PEOPLE 12 | 15<br />
Employment<br />
16–19<br />
Innovation<br />
20-23<br />
Entrepreneurship<br />
24-27<br />
Income<br />
28-31<br />
ECONOMY<br />
SOCIETY 32 | 43<br />
Per Capita Income by Race & Ethnicity<br />
Santa Clara & San Mateo Counties<br />
$70,000<br />
Median Income (Inflation Adjusted)<br />
60,000<br />
50,000<br />
40,000<br />
30,000<br />
20,000<br />
10,000<br />
0<br />
2005<br />
2007<br />
2009<br />
White Alone, not<br />
Hispanic or Latino<br />
Asian Alone<br />
Black or African<br />
American Alone<br />
Multiple<br />
and Other<br />
Hispanic or<br />
Latino<br />
PLACE 44 | 57<br />
Note: Multiple & Other includes Native Hawaiian & Other Pacific Islander Alone, American Indian & Alaska Native Alone,<br />
Some Other Race Alone, and Two or More Races<br />
Data Source: U.S. Census Bureau, American <strong>Community</strong> Survey<br />
Analysis: Collaborative Economics<br />
Percent Change in Per Capita Income – 2007-2009<br />
<strong>Silicon</strong> <strong>Valley</strong> California United States<br />
White, non-Hispanic -7% -6% -4%<br />
Asian, non-Hispanic -3% -2% -3%<br />
Black, non-Hispanic +2% -2% -3%<br />
Multiple & Other +6% -12% -6%<br />
Hispanic -7% -7% -7%<br />
Special Analysis cont. 58 | 67<br />
Appendices 68 | 72<br />
Acknowledgme nts | 73<br />
29


