

2011 Index of Silicon Valley - Silicon Valley Community Foundation
2011 Index of Silicon Valley - Silicon Valley Community Foundation
2011 Index of Silicon Valley - Silicon Valley Community Foundation

Create successful ePaper yourself
Turn your PDF publications into a flip-book with our unique Google optimized e-Paper software.
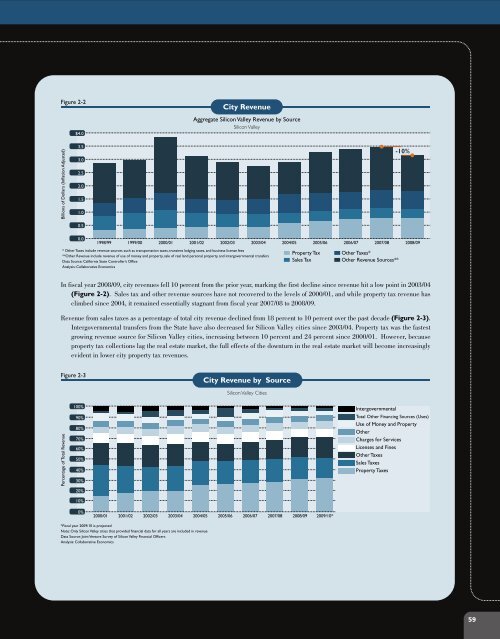
Figure 2-2<br />
$4.0<br />
City Revenue<br />
Aggregate <strong>Silicon</strong> <strong>Valley</strong> Revenue by Source<br />
<strong>Silicon</strong> <strong>Valley</strong><br />
Billions <strong>of</strong> Dollars (Inflation Adjusted)<br />
3.5<br />
3.0<br />
2.5<br />
2.0<br />
1.5<br />
1.0<br />
-10%<br />
0.5<br />
0.0<br />
1998/99 1999/00 2000/01 2001/02 2002/03 2003/04 2004/05 2005/06 2006/07 2007/08 2008/09<br />
* Other Taxes include revenue sources such as transportation taxes, transient lodging taxes, and business license fees<br />
**Other Revenue include revenue <strong>of</strong> use <strong>of</strong> money and property, sale <strong>of</strong> real land personal property, and intergovernmental transfers<br />
Data Source: California State Controller’s Office<br />
Analysis: Collaborative Economics<br />
Property Tax<br />
Sales Tax<br />
Other Taxes*<br />
Other Revenue Sources**<br />
In fiscal year 2008/09, city revenues fell 10 percent from the prior year, marking the first decline since revenue hit a low point in 2003/04<br />
(Figure 2-2). Sales tax and other revenue sources have not recovered to the levels <strong>of</strong> 2000/01, and while property tax revenue has<br />
climbed since 2004, it remained essentially stagnant from fiscal year 2007/08 to 2008/09.<br />
Revenue from sales taxes as a percentage <strong>of</strong> total city revenue declined from 18 percent to 10 percent over the past decade (Figure 2-3).<br />
Intergovernmental transfers from the State have also decreased for <strong>Silicon</strong> <strong>Valley</strong> cities since 2003/04. Property tax was the fastest<br />
growing revenue source for <strong>Silicon</strong> <strong>Valley</strong> cities, increasing between 10 percent and 24 percent since 2000/01. However, because<br />
property tax collections lag the real estate market, the full effects <strong>of</strong> the downturn in the real estate market will become increasingly<br />
evident in lower city property tax revenues.<br />
Figure 2-3<br />
City Revenue by Source<br />
<strong>Silicon</strong> <strong>Valley</strong> Cities<br />
Percentage <strong>of</strong> Total Revenue<br />
100%<br />
90%<br />
80%<br />
70%<br />
60%<br />
50%<br />
40%<br />
30%<br />
20%<br />
Intergovernmental<br />
Total Other Financing Sources (Uses)<br />
Use <strong>of</strong> Money and Property<br />
Other<br />
Charges for Services<br />
Licenses and Fines<br />
Other Taxes<br />
Sales Taxes<br />
Property Taxes<br />
10%<br />
0%<br />
2000/01 2001/02 2002/03 2003/04 2004/05 2005/06 2006/07 2007/08 2008/09 2009/10*<br />
*Fiscal year 2009/10 is projected<br />
Note: Only <strong>Silicon</strong> <strong>Valley</strong> cities that provided financial data for all years are included in revenue<br />
Data Source: Joint Venture Survey <strong>of</strong> <strong>Silicon</strong> <strong>Valley</strong> Financial Officers<br />
Analysis: Collaborative Economics<br />
59


