

2011 Index of Silicon Valley - Silicon Valley Community Foundation
2011 Index of Silicon Valley - Silicon Valley Community Foundation
2011 Index of Silicon Valley - Silicon Valley Community Foundation

You also want an ePaper? Increase the reach of your titles
YUMPU automatically turns print PDFs into web optimized ePapers that Google loves.
Special Analysis The Crisis in Local Government and Choices Facing Our Communities<br />
Understanding the Challenge<br />
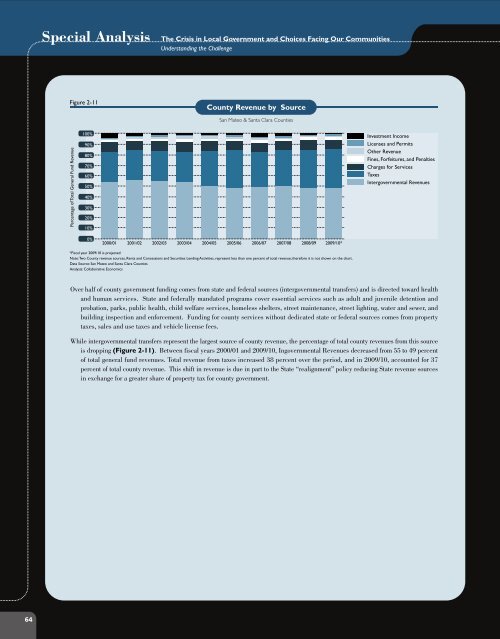
Figure 2-11<br />
County Revenue by Source<br />
San Mateo & Santa Clara Counties<br />
Percentage <strong>of</strong> Total General Fund Revenue<br />
100%<br />
90%<br />
80%<br />
70%<br />
60%<br />
50%<br />
40%<br />
30%<br />
20%<br />
10%<br />
Securities Investment Lending Income Activities<br />
Rents Licenses and and Concessions Permits<br />
Investment Other Revenue Income<br />
Licenses Fines, Forfeitures, and Permits and Penalties<br />
Other Charges Revenue for Services<br />
Fines, TaxesForfeitures, and Penalties<br />
Charges Intergovernmental for ServicesRevenues<br />
Taxes<br />
Intergovernmental Revenues<br />
0%<br />
2000/01 2001/02 2002/03 2003/04 2004/05 2005/06 2006/07 2007/08 2008/09 2009/10*<br />
*Fiscal year 2009/10 is projected<br />
Note: Two County revenue sources, Rents and Concessions and Securities Lending Activities, represent less than one percent <strong>of</strong> total revenue; therefore it is not shown on the chart.<br />
Data Source: San Mateo and Santa Clara Counties<br />
Analysis: Collaborative Economics<br />
Over half <strong>of</strong> county government funding comes from state and federal sources (intergovernmental transfers) and is directed toward health<br />
and human services. State and federally mandated programs cover essential services such as adult and juvenile detention and<br />
probation, parks, public health, child welfare services, homeless shelters, street maintenance, street lighting, water and sewer, and<br />
building inspection and enforcement. Funding for county services without dedicated state or federal sources comes from property<br />
taxes, sales and use taxes and vehicle license fees.<br />
While intergovernmental transfers represent the largest source <strong>of</strong> county revenue, the percentage <strong>of</strong> total county revenues from this source<br />
is dropping (Figure 2-11). Between fiscal years 2000/01 and 2009/10, Ingovernmental Revenues decreased from 55 to 49 percent<br />
<strong>of</strong> total general fund revenues. Total revenue from taxes increased 38 percent over the period, and in 2009/10, accounted for 37<br />
percent <strong>of</strong> total county revenue. This shift in revenue is due in part to the State “realignment” policy reducing State revenue sources<br />
in exchange for a greater share <strong>of</strong> property tax for county government.<br />
64


