


You also want an ePaper? Increase the reach of your titles
YUMPU automatically turns print PDFs into web optimized ePapers that Google loves.
coverstory<br />
www.tradersonline-mag.com 04.2014<br />
In December 2012 and January 2013, a rather narrow<br />
rectangle had formed within the limits of 71 to 73.50<br />
euros. In such a case, the probability of the following<br />
scenario occurring is quite high: A strong buyer (Goliath 1)<br />
bought at 71, a strong seller (Goliath 2) sold at 73.50<br />
and the rest of the market participants provided the<br />
fluctuation between these two price levels. “Strong” here<br />
means: There is an interest on the part of a single market<br />
participant (a major investor) in building up or reducing a<br />
large position in the stock.<br />
Then, on 25th January, there was a large upward bar<br />
with a closing price above 76 euros (first marking). This<br />
was a strong buy signal since the seller who had sold at<br />
73.50 euros had apparently sold his holdings while the<br />
strong buyer was still in the market. This is a suitable<br />
signal for our trader David to open a long position. But<br />
there are also false signals, and this was one of them.<br />
Within just a few days the price dropped again below<br />
73.50 euros.<br />
Just on the strength of the many new buyers being<br />
attracted by such a signal, this should actually not have<br />
happened. So the seller was still there after all and<br />
managed to get rid of some of his stocks at much higher<br />
prices. So far, so bad for the breakout trader. False signals<br />
are part and parcel of any trading system. That’s why you<br />
need a stop management system that in case of loss stops<br />
out a position again after a short period of time (second<br />
marking). At this point, all you can do is just regret the<br />
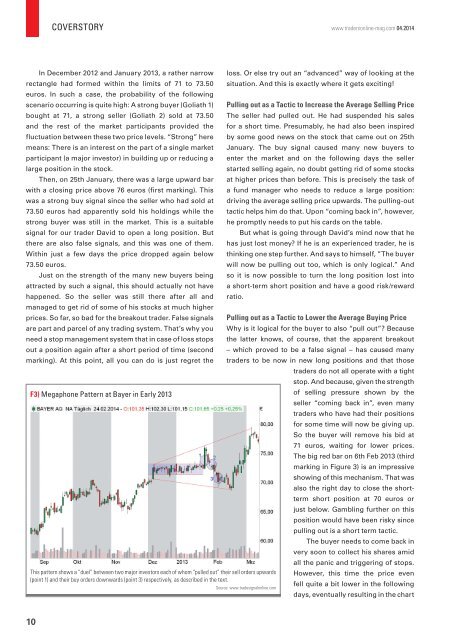
F3) Megaphone Pattern at Bayer in Early 2013<br />
This pattern shows a “duel” between two major investors each of whom “pulled out” their sell orders upwards<br />
(point 1) and their buy orders downwards (point 3) respectively, as described in the text.<br />
loss. Or else try out an “advanced” way of looking at the<br />
situation. And this is exactly where it gets exciting!<br />
Pulling out as a Tactic to Increase the Average Selling Price<br />
The seller had pulled out. He had suspended his sales<br />
for a short time. Presumably, he had also been inspired<br />
by some good news on the stock that came out on 25th<br />
January. The buy signal caused many new buyers to<br />
enter the market and on the following days the seller<br />
started selling again, no doubt getting rid of some stocks<br />
at higher prices than before. This is precisely the task of<br />
a fund manager who needs to reduce a large position:<br />
driving the average selling price upwards. The pulling-out<br />
tactic helps him do that. Upon “coming back in”, however,<br />
he promptly needs to put his cards on the table.<br />
But what is going through David’s mind now that he<br />
has just lost money If he is an experienced trader, he is<br />
thinking one step further. And says to himself, ”The buyer<br />
will now be pulling out too, which is only logical.” And<br />
so it is now possible to turn the long position lost into<br />
a short-term short position and have a good risk/reward<br />
ratio.<br />
Pulling out as a Tactic to Lower the Average Buying Price<br />
Why is it logical for the buyer to also “pull out” Because<br />
the latter knows, of course, that the apparent breakout<br />
– which proved to be a false signal – has caused many<br />
traders to be now in new long positions and that those<br />
traders do not all operate with a tight<br />
stop. And because, given the strength<br />
of selling pressure shown by the<br />
seller “coming back in”, even many<br />
traders who have had their positions<br />
for some time will now be giving up.<br />
So the buyer will remove his bid at<br />
71 euros, waiting for lower prices.<br />
The big red bar on 6th Feb 2013 (third<br />
marking in Figure 3) is an impressive<br />
showing of this mechanism. That was<br />
also the right day to close the shortterm<br />
short position at 70 euros or<br />
just below. Gambling further on this<br />
position would have been risky since<br />
pulling out is a short term tactic.<br />
The buyer needs to come back in<br />
very soon to collect his shares amid<br />
all the panic and triggering of stops.<br />
However, this time the price even<br />
fell quite a bit lower in the following<br />
days, eventually resulting in the chart<br />
Source: www.tradesignalonline.com<br />
10