


Create successful ePaper yourself
Turn your PDF publications into a flip-book with our unique Google optimized e-Paper software.
strategies<br />
www.tradersonline-mag.com 04.2014<br />
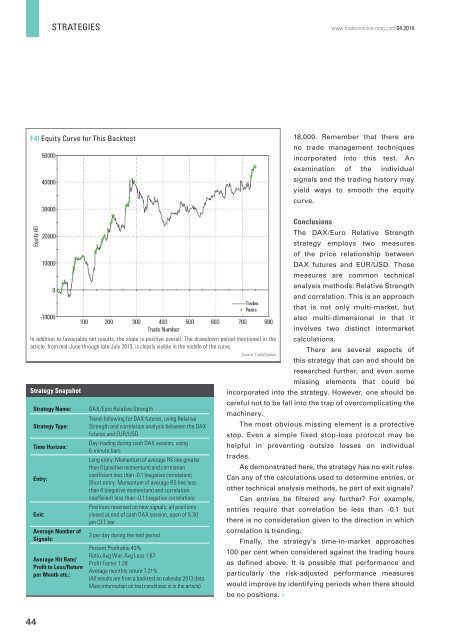
F4) Equity Curve for This Backtest<br />
18,000. Remember that there are<br />
no trade management techniques<br />
incorporated into this test. An<br />
examination of the individual<br />
signals and the trading history may<br />
yield ways to smooth the equity<br />
curve.<br />
In addition to favourable net results, the slope is positive overall. The drawdown period mentioned in the<br />
article, from mid-June through late July 2013, is clearly visible in the middle of the curve.<br />
Strategy Snapshot<br />
Strategy Name:<br />
Strategy Type:<br />
Time Horizon:<br />
Entry:<br />
Exit:<br />
Average Number of<br />
Signals:<br />
Average Hit Rate/<br />
Profit to Loss/Return<br />
per Month etc.:<br />
DAX/Euro Relative Strength<br />
Trend-following for DAX futures, using Relative<br />
Strength and correlation analysis between the DAX<br />
futures and EUR/USD<br />
Day-trading during cash DAX session, using<br />
6-minute bars<br />
Long entry: Momentum of average RS line greater<br />
than 0 (positive momentum) and correlation<br />
coefficient less than -0.1 (negative correlation)<br />
Short entry: Momentum of average RS line less<br />
than 0 (negative momentum) and correlation<br />
coefficient less than -0.1 (negative correlation)<br />
Positions reversed on new signals; all positions<br />
closed at end of cash DAX session, open of 5.30<br />
pm CET bar<br />
3 per day during the test period<br />
Percent Profitable 43%<br />
Ratio Avg Win: Avg Loss 1.67<br />
Profit Factor 1.28<br />
Average monthly return 7.21%<br />
(All results are from a backtest on calendar 2013 data.<br />
More information on test conditions is in the article)<br />
Conclusions<br />
The DAX/Euro Relative Strength<br />
strategy employs two measures<br />
of the price relationship between<br />
DAX futures and EUR/USD. Those<br />
measures are common technical<br />
analysis methods: Relative Strength<br />
and correlation. This is an approach<br />
that is not only multi-market, but<br />
also multi-dimensional in that it<br />
involves two distinct intermarket<br />
calculations.<br />
There are several aspects of<br />
Source: TradeStation<br />
this strategy that can and should be<br />
researched further, and even some<br />
missing elements that could be<br />
incorporated into the strategy. However, one should be<br />
careful not to be fall into the trap of overcomplicating the<br />
machinery.<br />
The most obvious missing element is a protective<br />
stop. Even a simple fixed stop-loss protocol may be<br />
helpful in preventing outsize losses on individual<br />
trades.<br />
As demonstrated here, the strategy has no exit rules.<br />
Can any of the calculations used to determine entries, or<br />
other technical analysis methods, be part of exit signals<br />
Can entries be filtered any further For example,<br />
entries require that correlation be less than -0.1 but<br />
there is no consideration given to the direction in which<br />
correlation is trending.<br />
Finally, the strategy’s time-in-market approaches<br />
100 per cent when considered against the trading hours<br />
as defined above. It is possible that performance and<br />
particularly the risk-adjusted performance measures<br />
would improve by identifying periods when there should<br />
be no positions. «<br />
44