


You also want an ePaper? Increase the reach of your titles
YUMPU automatically turns print PDFs into web optimized ePapers that Google loves.
strategies<br />
With a little observation and<br />
a bit of experimentation you can<br />
create a simple trading strategy.<br />
assumes that the “blind“ following of the standard<br />
parameters is not successful. The same goes with the<br />
RSI – ultimately the market can stay in extremes for a<br />
long time if it is a strong trend – and that can lead to<br />
losses in trading.<br />
Modification of the Standard Parameters<br />
With a little observation and a bit of experimentation you<br />
can easily create a simple trading strategy even with old<br />
indicators. In our case the RSI is calculated based on 21<br />
candles instead of 14. Therefore the oscillator becomes<br />
slower and less volatile. Below 40 is oversold and the<br />
overbought-level is reached at the RSI-value of 80. We<br />
trade this system only long in the hourly chart. We hold a<br />
position overnight if necessary.<br />
Entry, Stop and Re-Entry<br />
Signal-generating is very easy with<br />
the RSI return strategy: If the RSI<br />
is below 40 at the close of a 1-hour<br />
candle a long-signal is generated.<br />
But it is only activated if the RSI then<br />
closes above this line on the 1-hour<br />
basis. The results of past years<br />
confirm that the return of the RSI –<br />
hence the name “RSI Return“ – is a<br />
wise approach compared to direct<br />
entry upon reaching the extremes.<br />
Therefore you avoid to “catching a<br />
falling knife”.<br />
There is no profit target with this<br />
strategy. You close the long-position,<br />
if the RSI climbs above 80 and then<br />
drops below.<br />
A trading strategy is only<br />
complete if the stop-loss is defined<br />
to limit the losses and to secure<br />
the book profits. In this strategy<br />
we use a 21-period ATR stop. At<br />
the entry we place the stop at the<br />
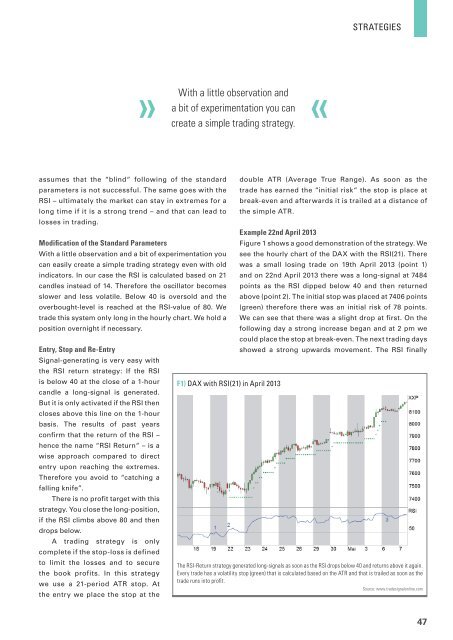
F1) DAX with RSI(21) in April 2013<br />
double ATR (Average True Range). As soon as the<br />
trade has earned the “initial risk“ the stop is place at<br />
break-even and afterwards it is trailed at a distance of<br />
the simple ATR.<br />
Example 22nd April 2013<br />
Figure 1 shows a good demonstration of the strategy. We<br />
see the hourly chart of the DAX with the RSI(21). There<br />
was a small losing trade on 19th April 2013 (point 1)<br />
and on 22nd April 2013 there was a long-signal at 7484<br />
points as the RSI dipped below 40 and then returned<br />
above (point 2). The initial stop was placed at 7406 points<br />
(green) therefore there was an initial risk of 78 points.<br />
We can see that there was a slight drop at first. On the<br />
following day a strong increase began and at 2 pm we<br />
could place the stop at break-even. The next trading days<br />
showed a strong upwards movement. The RSI finally<br />
The RSI-Return strategy generated long-signals as soon as the RSI drops below 40 and returns above it again.<br />
Every trade has a volatility stop (green) that is calculated based on the ATR and that is trailed as soon as the<br />
trade runs into profit.<br />
Source: www.tradesignalonline.com<br />
47